There are several ways to create a new histogram in WinList: from ribbon bar or menu, by drawing the histogram window, or by using the Create Multiple Histograms dialog.
The ribbon bar has several buttons on the Home tab that create 1P, 2P, and 3P histograms on the active data source. These will show the last-used parameters, by default. You'll find additional commands on the Insert tab that allow you to create dot plots, density plots, and contour plots quickly. If you are using the toolbar and menu interface, you'll find the Create Histogram command in the Create menu.
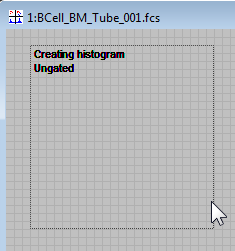
Histograms can also be created by clicking and dragging the mouse in an empty portion of a data source window to define the size and location of a histogram. After defining the area, release the mouse button to display the Edit Histogram dialog and to choose the parameters to display.
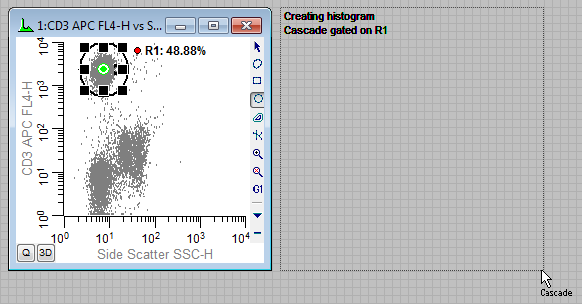
You can draw a gated histogram in a similar manner by first clicking on the Cascade Gate hotspot on an active region. The hotspot will change from red to green. As you draw the histogram, text will be displayed to show how the histogram will be gated.
See also: