This section contains descriptions of the models used by ModFit LT.
Model naming
When Auto-analysis or Choose model commands are used to create models, the program uses the following logic to create a name for the model.
Position in name |
Meaning |
1 |
Number of cycles |
2 |
'D' if AutoDebris is enabled; 'n' if not |
3 |
'A' if AutoAggregates is enabled; 'n' if not |
4 |
Number of standards |
5 |
'A' if Apoptosis is enabled; 'n' if not |
For each cycle in the model, the name includes the following:
An underscore (_) character;
The first character of the cycle's ploidy, i.e. D=Diploid, A=Aneuploid, T=Tetraploid, H=Hypo-diploid;
'S' if S-Phase is active, or 'n' if not; and
'F' if G2M is active and floating, 'D' if active and dependent, 'n' if G2 inactive. Floating means that the mean position and standard deviation are adjusted during the modeling process. This gives more freedom to the model, but the peak must be unambiguous. Dependent means that the position and standard deviation of the G2M are computed by multiplying the G1 position and standard deviation by a factor of 2.0 or your chosen linearity setting. Inactive means that the G2M is not modeled.
For example, the model name "3DA0n_DSD_AnD_ASF" can be interpreted to mean that there are 3 cycles, AutoDebris is enabled, AutoAggregates is enabled, zero standards, and apoptosis is not being modeled. The first cell cycle is Diploid, with S-Phase active and a Dependent G2M. The second cycle is Aneuploid, S-Phase is turned off and the G2M is dependent. The third cycle is also Aneuploid, S-Phase is enabled, and the G2M position is allowed to float.
Ranges and their uses
The table below shows the ranges used by ModFit LT and the populations they are used to identify.
Range |
Usage |
Debris |
Left side placed at start of downward sloping debris, right side extended through roughly 2/3 of the histogram. Provides estimates for AutoDebris component. |
Stnd 1 |
Identifies the peak of the first standard. The range should be positioned to encompass the standard peak. If you have named your standards, the range will show the name you assign. See Auto Analysis Settings for details on naming standards. |
Stnd 2 |
Identifies the peak of the second standard. The range should be positioned to encompass the standard peak. If you have named your standards, the range will show the name you assign. |
Dip G1 |
Identifies the G1 of the Diploid cycle. The range should be positioned to encompass the peak. |
Dip G2 |
Identifies the G2 of the Diploid cycle. The range should be positioned to encompass the peak. |
Cycle G1 and G2 |
Identify the G1 and G2 for each additional cycle. The range should be positioned to encompass the associated peak. |
When you use automatic analysis, ModFit LT constructs a model for you based on the peaks it can identify in the data sample. It looks at how many peaks there are, their standard deviations, areas, and relative locations, then takes its best shot at deducing the ploidy, debris, and aggregation aspects of the sample. It builds a model that matches what it finds. The black triangles at the base of the histogram show the peaks the program has identified.
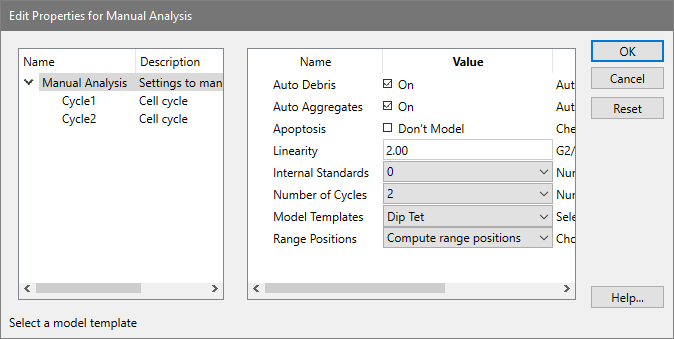
When you select a model yourself using the Choose Model option, you are presented with the dialog pictured below. With this dialog, you make the decisions about the sample.
Colors
ModFit LT allows you to edit the colors used by the model using the Colors command. The default color assignments are listed in the table below.
Component |
Color |
Diploid G0-G1 |
red |
Diploid G2-M |
red |
Diploid S-Phase |
reverse-hatched blue |
Aneuploid G0-G1 |
1st is bright yellow; others become darker shades of yellow |
Aneuploid G2-M |
1st is bright yellow; others become darker shades of yellow |
Aneuploid S-Phase |
forward-hatched blue |
AutoAggregates |
light green |
AutoDebris |
medium blue |
Apoptosis |
sky blue |
1st Standard |
dark gray |
2nd Standard |
light gray |
Component Shapes
The parts of ModFit LT's models are comprised of several component shapes. The table below shows the shapes used by the models, and where they are used.
Component |
Shape |
Uses |
Gaussian |
|
Gaussian components are used to model peaks. They are often linked to ranges. |
Rectangle |
|
This component is typically used to model S-Phase. The peaks on either side of it determine boundaries and standard deviations. |
Trapezoid |
|
This component can be used to model S-Phase. It has an additional degree of freedom over the rectangle and generally yields higher S-Phase values. The peaks on either side of it determine boundaries and standard deviations. |
Polynomial |
|
This component can be used to model S-Phase. It has an additional degree of freedom over the trapezoid and should be used with caution. The peaks on either side of it determine boundaries and standard deviations. |
AutoDebris |
|
The AutoDebris component is used to model debris. Its starting point is based on the position of the Debris range. |
AutoAggregate |
|
This component is used for aggregate compensation. Its shape is unique to each histogram. It does not use a range. |
Weibull |
|
This component can be used to model skewed peaks in custom models. Contact Verity technical support for assistance with this component. |
See also:
Choose Model command (Analysis menu)