If ModFit LT has difficulty detecting peaks or identifying the ploidy patterns of a sample using automatic analysis, you can use manual analysis to analyze the data.
Manual analysis involves several steps. First, you open the sample you want to analyze. Next, you use the Choose Model dialog box to select a model that matches your assessment of the sample. Once the model is selected, you need to position ranges over important peaks, and finally tell the program to analyze the sample.
When to Use Manual Analysis
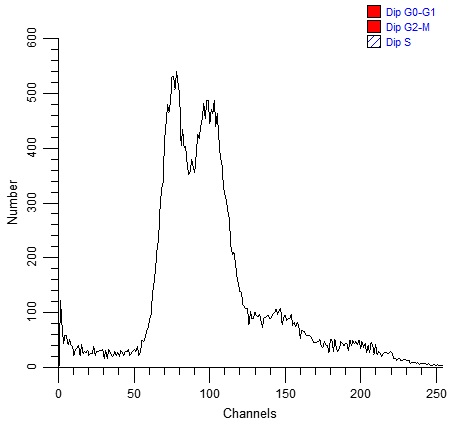
Here is an example.

There are several problems with this histogram, the most important being that its peaks are very broad and indistinct. In order for Auto Analysis to succeed, the important peaks in the histogram must be correctly identified. Peaks are shown by the small black triangles under the graphic. The program probably missed one or both of the dominant peaks in the histogram.
This is a circumstance where you must use manual analysis to model the sample. Even if the peaks are all detected, you can still continue with this tutorial.
Choosing a Model
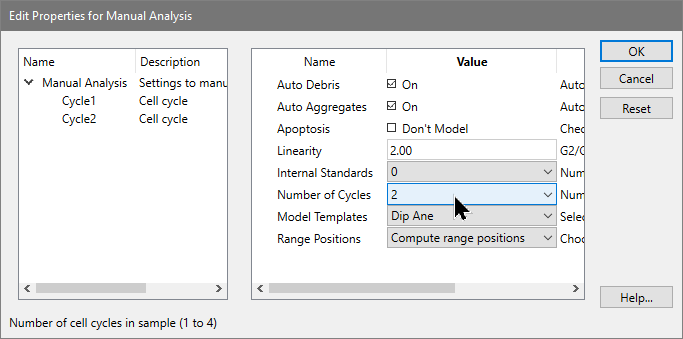
 and a dialog is displayed.
This dialog allows you to define the model that you want to use for the histogram. Based on the options you choose, the program will construct a model to match those assumptions. This is a DNA Aneuploid sample, so the selections we make in the dialog need to reflect that.

Adjusting Ranges
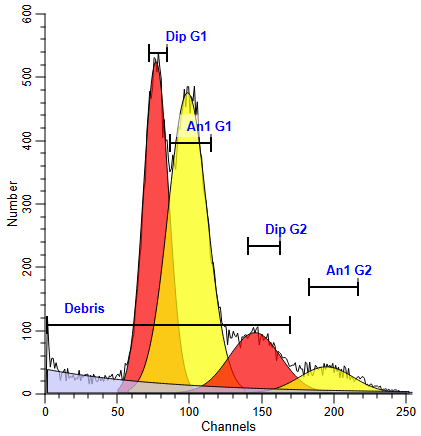
The program will construct the model and try to position the model ranges over detected peaks. It switches to the Range view automatically. You can switch to this view anytime by clicking the Range button on the ribbon.
In the Range view, you can position ranges over the peaks in the sample. You move a range by clicking on the range label, and dragging it to a new location with the mouse button down. When finished, you release the mouse button. To adjust the width of a range, click the black handle and drag to choose a new size. If a range is already correctly positioned and sized, do not move or resize it.
Notice that as you move a range, the left pane on the status bar displays information about the range position. The left and right values are in the units shown on the X-axis; the top is in number of events. When the mouse button is released, the status bar indicates the fitted estimates for the range.

Fitting the Model
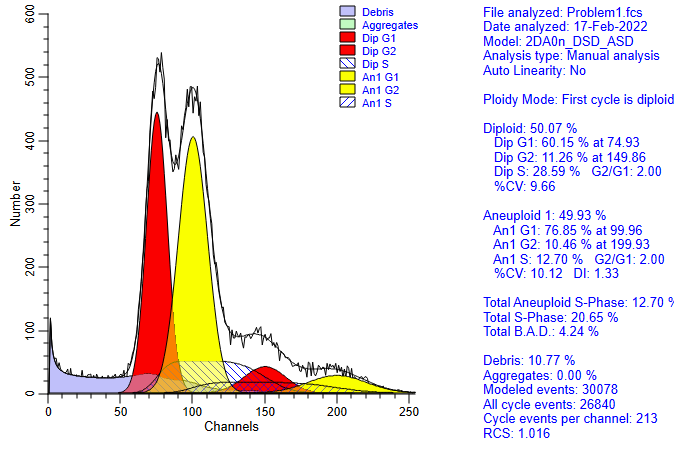
With the ranges in position, you are ready to analyze the sample.
 on the ribbon to
perform the non-linear least squares fit. The results will be similar
to the one shown here.

Summary
The manual analysis mode should be used when the peak finder or automatic analysis mode fails, or you need to make your own decisions about how to model a sample. It enables user-intervention at the key points in the analysis: model selection and range positioning.
Models are selected using the Choose Model option on the Home tab of the ribbon bar.
Ranges used to identify peaks must be positioned so that each range identifies a unique peak; they should not overlap. For example, the Dip G1 range is used to identify the Diploid G0G1 peak, and no other peak range should be placed over the same peak. You should not, for example, place the An1 G1 range over the same peak as the Dip G1 range. The Debris range is the only exception. Since it does not identify a peak, it should be stretched across about two-thirds of the histogram.
See also: