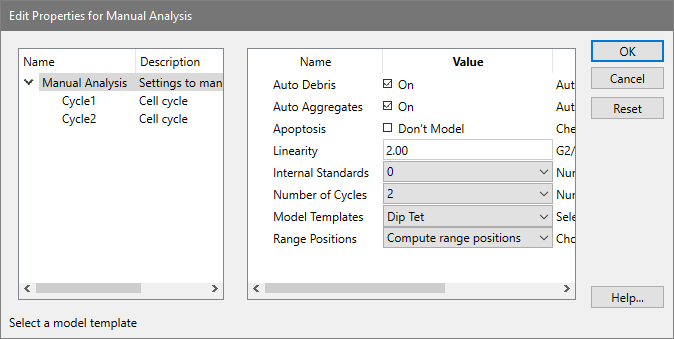

Use this command to select a model to use in the manual analysis of the data. A model consists of a set of components, which are linked together based on the choices you make in this dialog.

Selecting a model does not actually perform an analysis. After choosing
a model, you need to position its ranges and click the Fit
button  to analyze the data with the model.
The left portion of the dialog contains a tree diagram of the model. The top of the tree is the Manual Analysis branch, and the choices you need to make when selecting a model are described below. Also shown in the tree is a branch for each cell cycle you want to model. The number of cycles you see will depend on what you choose for "Number of cycles" in the dialog.
After making your initial model selections with the Manual Analysis branch selected, you can fine-tune the model by selected each cycle branch and adjusting its properties. See the Edit Properties for Cycle dialog box for details on cycle properties.
AutoDebris
To enable debris modeling, check this option. The AutoDebris component can model debris from fresh, frozen, pulverized, and paraffin samples. If the sample shows little or no debris, you may choose to disable this option.
AutoAggregates
Check this option to enable a model component that automatically fits most forms of aggregation. Aggregates can form in the sample as cells and cell fragments stick together. Because all sizes and shapes of cells can form aggregates, the AutoAggregate component is a continuous distribution. Its shape is unique for each data file, and is based on probabilities of cells in each channel sticking together. To disable the AutoAggregates component, uncheck this option.
Apoptosis
Note: this is not the recommended approach to use for Apoptosis. Secondary markers are much more robust and accurate.
Check this option to model an apoptosis distribution in the sample. A Gaussian will be used to model a peak, and a range to identify the peak will be displayed.
Linearity
Enter a linearity value for the sample. This value can be determined by dividing the G2M position for a cycle by the G1 position for the same cycle. The program will use the linearity value for computing positions for G2M populations that are not clearly defined peaks, and for the AutoAggregate model component.
Standards
Use this option to select the number of internal standards that appear as distinct peaks in the sample.
Number of cycles
Choose the number of cell cycles that appear in the sample. Each cell cycle contains model components for G1, S-Phase, and G2M populations.
Model templates
After choosing the number of cycles above, select a model template that best describes the cycles. The templates are named with abbreviated forms of the common cell cycle names: "Dip" is Diploid, "Ane" is Aneuploid, "Tet" is Tetraploid, "Hyp" is Hyper-Diploid, and "NearDip" is Near-Diploid.
Notice that the model template name determines the relative positions of the cycles in the model. For example, with 3 cycles, there is a template for "Dip Ane Tet" and another for "Dip Tet Ane". The "Dip Ane Tet" template is designed for the Aneuploid appearing between the Diploid and the Tetraploid populations; the "Dip Tet Ane" is designed for the Aneuploid appearing above (to the right of) the Tetraploid population.
The available model templates will change depending on the number of cell cycles you have selected to model.
Range positions
This option allows you to determine whether or not the program will re-position ranges upon choosing OK. If you have already selected a model and are making some adjustments in this dialog, choose "Use current range positions". If you are selecting a new model, choose "Compute range positions" to determine the initial locations for the ranges.
OK
Click this button to create a model matching your selections and display the ranges for the model. After clicking OK, position the ranges and click the Fit button on the toolbar.
The selected model will be used until 1) another model is selected using Choose Model, 2) an automatic analysis is performed, 3) a new report document is loaded, or 4) you close the program.
Cancel
Click this button to close the dialog without creating a model.
Reset
Click this button to restore the dialog to a default model.
See Also