Overlay windows are a great tool for graphically comparing a set of 1P or 2P plots. Offering different views and a wide variety of graphical options, overlays organize plots - typically from different files - so that you can easily see the similarities and differences among them. This tutorial explores how to create overlays and some of the properties you may find most useful.
If you are unfamiliar with opening files and creating histograms with WinList, you might want to do the WinList Basics tutorial before continuing with this one.
Getting Started
We'll start by opening a listmode file and creating some histograms.
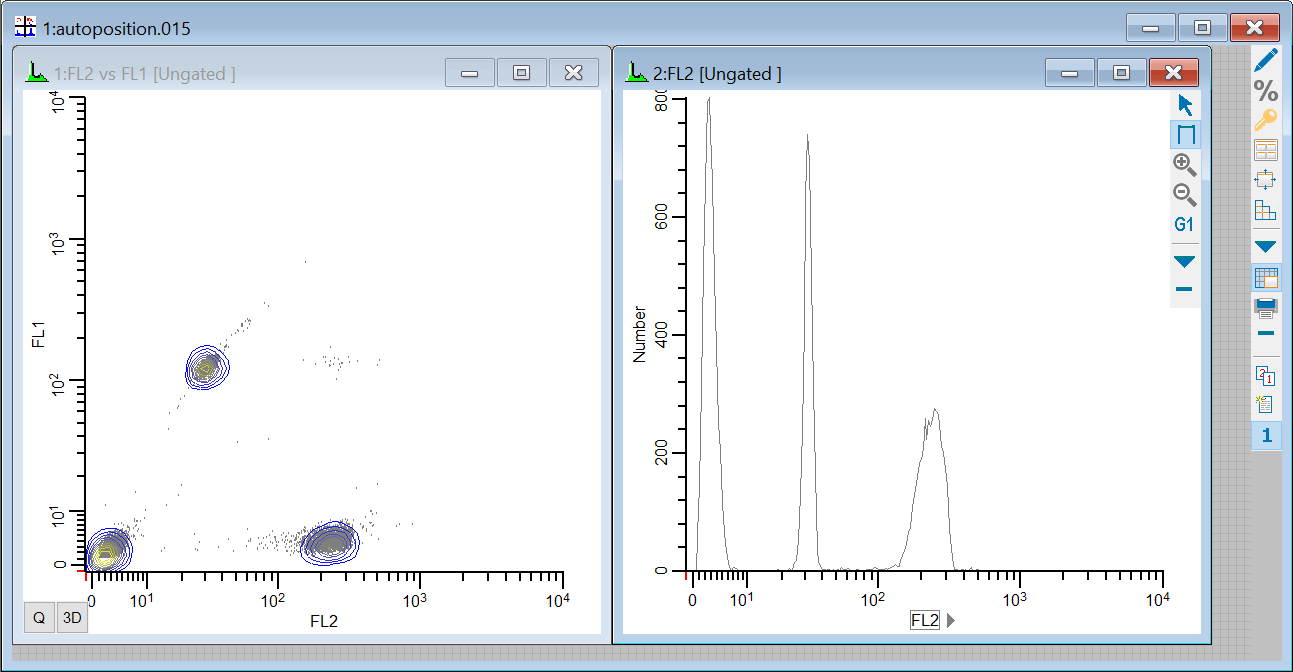
1. Click the Open FCS button on the ribbon bar and navigate to the Samples\AutoPosition folder located in the folder where WinList is installed. Select autoposition.015 from the list and click Open.
2. In the Create Histograms dialog, select FL2 in the X Axis list and FL1 in the Y Axis list. Click the Add to List button.
3. Click the 1P Histograms tab in the dialog. Choose FL2 in the X Axis list and click the Add to List button.
4. Click OK to close the dialog and display the histograms.

We're going to look at a series of samples in which the intensity of the marker in FL2 diminishes, and we will overlay the graphics to compare the changes. Let's create two overlay windows, one for the 1P graphics and the other for 2P graphics.
5. Click the Overlay button on the ribbon bar two times to create two overlay windows. Move the windows to a convenient location on your screen.

To add a histogram to an overlay, you simply drag-and-drop the histogram by the icon in the top left corner of its title bar.

6. Drag-and-drop the 1P histogram onto the first overlay window, and then drag-and-drop the 2P histogram onto the second overlay.
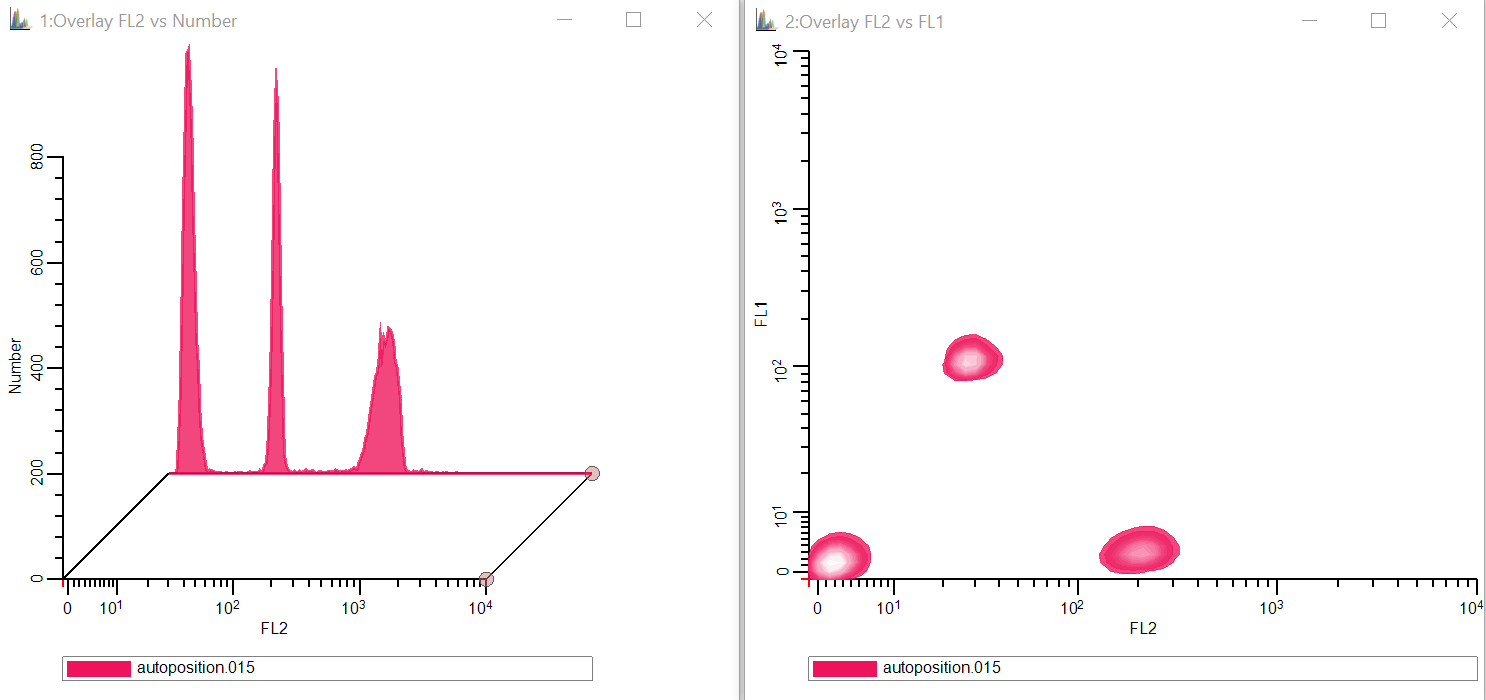
The first element added to an overlay window determines several key properties for the overlay. The overlay will become a 1P or 2P overlay depending on the type of histogram that is added. The axis displayed for the overlay is based on the first element, too. Let's add a couple more elements to each overlay.
7. Click the Next FCS File button on the ribbon bar and select the next file in the folder: autoPosition.016. Click Open to read the file into WinList.
8. Drag-and-drop each histogram onto the associated overlay window to add new elements for this new data file.
9. Click the Next FCS File button and select autoPosition.017. Click Open to read the file.
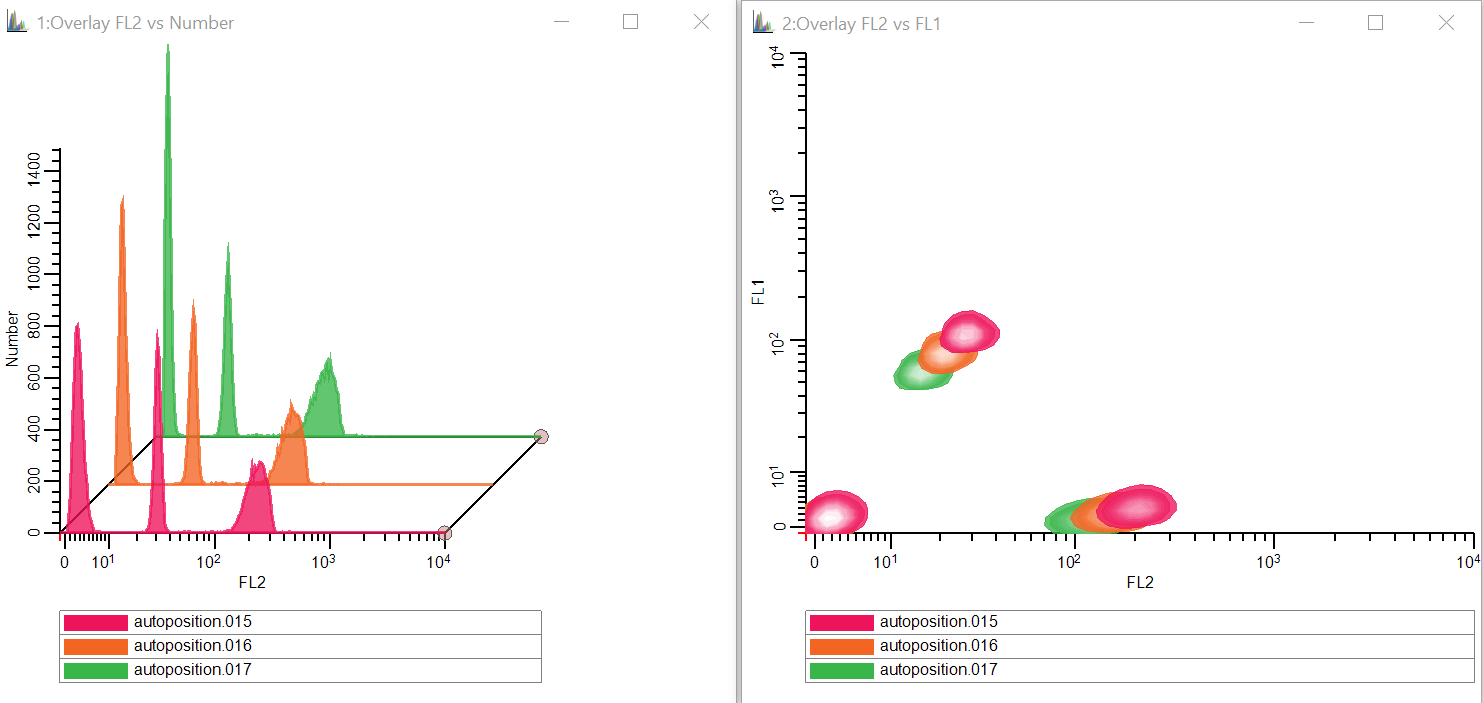
10. Drag-and-drop each histogram onto the associated overlay window. You should now have 3 elements in each overlay window.
Editing Overlays
Notice that the 1P overlay has a left-to-right arrangement, while the 2P overlay is a straight overlaid arrangement. These are the default settings for each overlay type, but they can be changed. We can also change other properties of the overlay and its elements. Let's explore.
11. Right-click inside the 1P overlay window and choose Edit from the context menu. The Edit Properties dialog for the overlay is displayed.
In this first panel of the dialog, we can change settings that affect the overall appearance of the overlay and some things common to all elements. For example, we could change the transparency or the line weight of the histograms, the fonts used, or whether to show grids. This is also where we can select the view of the overlay items.
Let's look at the properties that can be changed on individual elements of the overlay.
12. In the tree on the left side of the Edit Properties dialog, click the first element, autoposition.015. The properties for this element are displayed.
13. Edit the Label so that it reads Time=0h. This label will now be used in the legend for the first item.
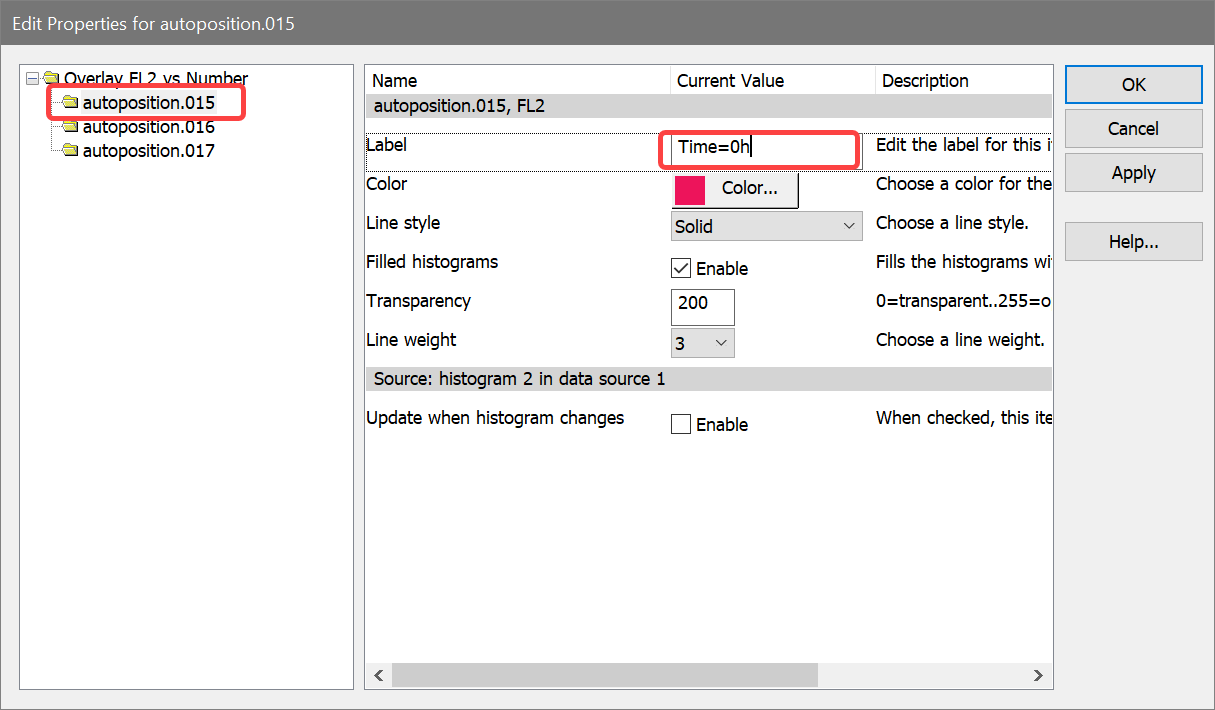
14. Select autoposition.016 in the tree on the left, and edit its label to Time=6h.
15. Select autoposition.017 in the tree on the left, and edit its label to Time=12h.
You can also change the color and line style with this editor. Of special interest is the Update when histogram changes option. With this option enabled, the element would update in the overlay any time that the histogram it came from changes - a very useful option for some or all elements in an overlay. In our example here, however, we will leave the option unchecked because we want the elements to remain unchanged.
16. Click OK to close the dialog and see the changes.
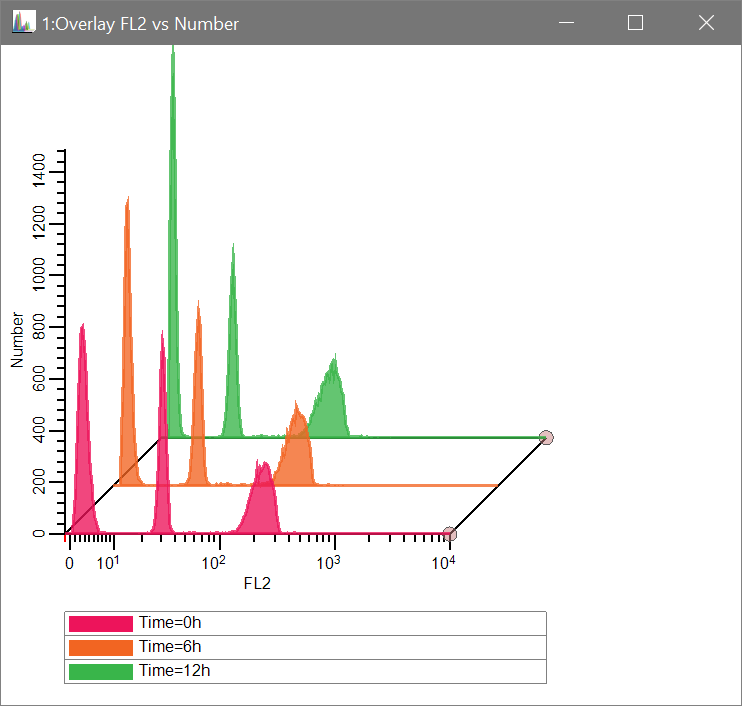
Did you notice the small handles on the right side of the axis in the 1P overlay? They can be dragged to change the left-to-right perspective. The lower handle moves left and right to adjust the width of the X-axis. The back handle adjusts up and down to control the tilt of the arrangement. These handles only appear in Left-to-Right view for an overlay.
Let's take a look at the 2P overlay. Suppose we want to change the order of the elements that we overlaid so that the first element was in the back of the stack and the last element was in the front. We do that by dragging elements in the legend at the bottom of the window.
17. Drag the autoposition.017 element in the legend to the top of the legend and drop it. It becomes the front element in the stack.
18. Drag the autoposition.015 element to the bottom of the legend and drop it. It becomes the last in the overlay stack.
Overlays are part of a WinList protocol file, so when you save your protocol, you save the overlays, too. This means that you can set up overlays as part of your experiments, adding to them as you work on new samples. Overlays can be copied in high-resolution to the clipboard and pasted into other apps. They can also be saved to disk in many popular graphics formats for use with publications.
See also: