
A key component in the design of WinList is fast, efficient performance. This applies not only to the inner workings of the program, but also to the user-interface. Everything you do with the program is designed to be easy to understand and highly efficient.
This introduction focuses on the fundamentals of working with WinList. In the course of the tutorial, you will see how quickly and easily you can create an analysis setup with WinList. Opening files, creating histograms, drawing regions and gates, and developing reports are all covered in this exercise.
Open files
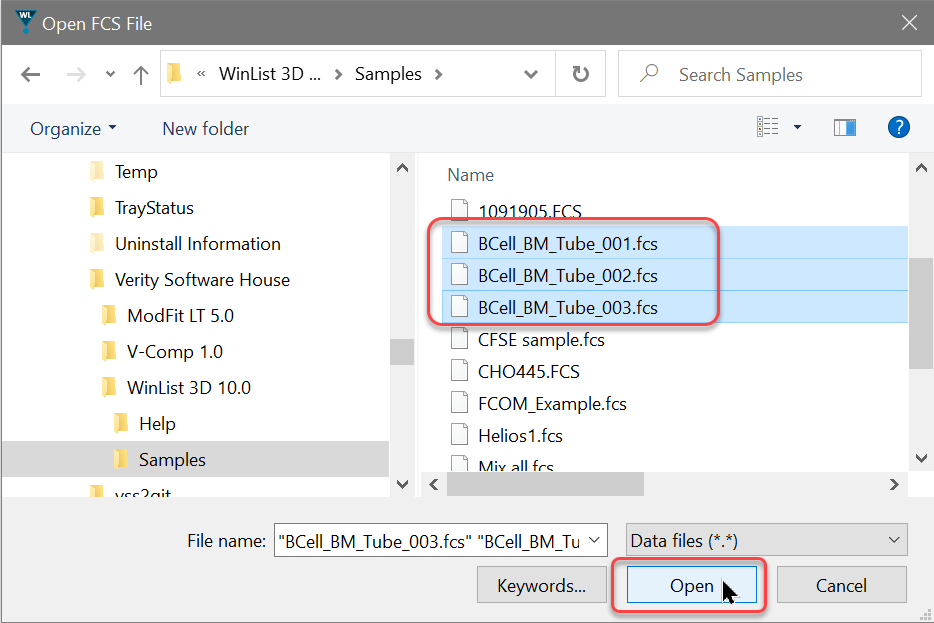
1. Click the Open FCS File button on the ribbon bar.
2. In the File Open dialog, navigate to the Samples folder located in the folder where WinList is installed. Select the three files BCell_BM_Tube_001.fcs, BCell_BM_Tube_002.fcs, and BCell_BM_Tube_003.fcs and click Open.
You can also drag and drop files from Windows Explorer onto WinList. See Drag and Drop for details.
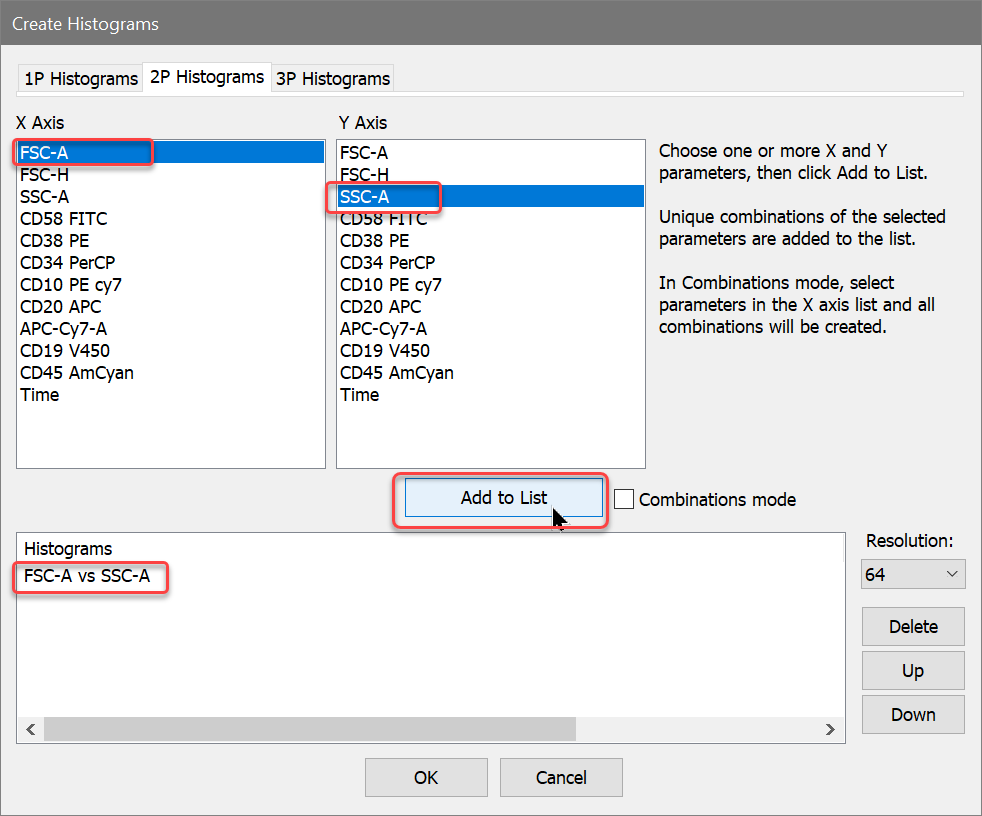
The Create Histograms dialog will appear.
Create histograms
This dialog allows you to create any number of histograms very quickly. We will create several 2P histograms. The dialog also allows you to create 1P and 3P histograms.
3. Select FSC-A in the X Axis list, and SSC-A in the Y Axis list. Then click the Add to List button.
4. In the X Axis list, select CD10 PE Cy7, CD20 APC, and CD45 AmCyan. Enable the Combinations mode checkbox. Click the Add to List button. In this mode, histograms are created for all combinations of the selected parameters.
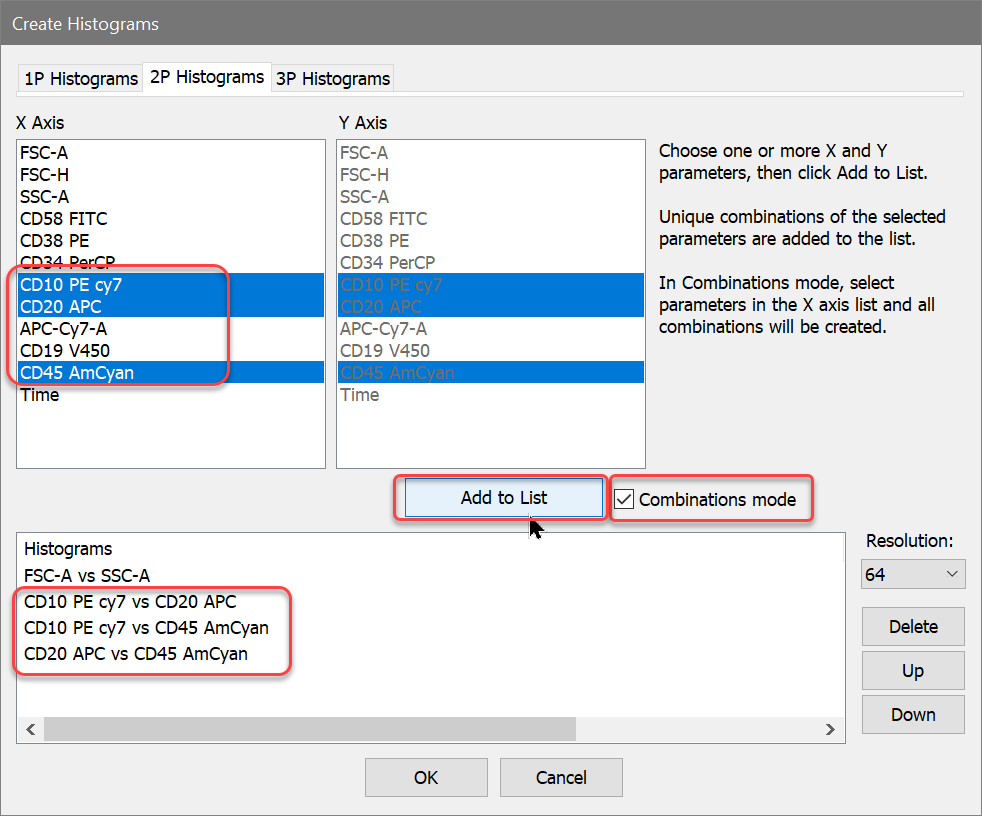
5. Click the OK button.
You can also create one histogram at a time by clicking and dragging on a data source to define the area where you want the new histogram. The next tutorial illustrates this technique.
Create a light scatter region
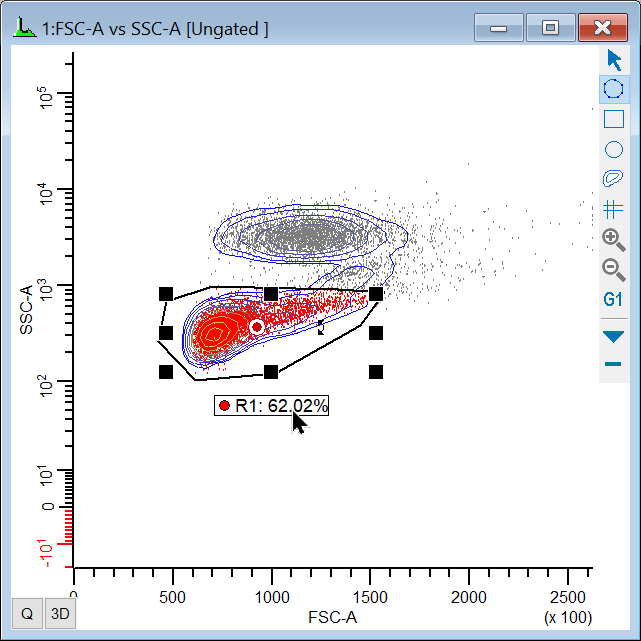
Next, we'll draw a light-scatter gate on the FSC-A vs. SSC-A histogram.
6. Click the title bar of the FSC-A vs. SSC-A histogram and select the Freehand region tool from the toolbar on the right side of the window.
The histogram toolbar has tools for creating other types of regions.
7. Draw a region around the population shown. To finish drawing the region, click on the point that appeared when the drawing began.
If you want to delete a region, click on the region's label and press the Delete key on the keyboard.
Gate the histograms
With the R1 region drawn, we can now gate the other histograms on R1.
8. Click the mouse on the red bulls-eye in the middle of the R1 region. This is called the "cascade hotspot" and is used to apply the R1 gate to other histograms.
9. Press the Shift key on the keyboard and click the title bar of each of the remaining histograms. As you click, the gate is applied to the histograms.
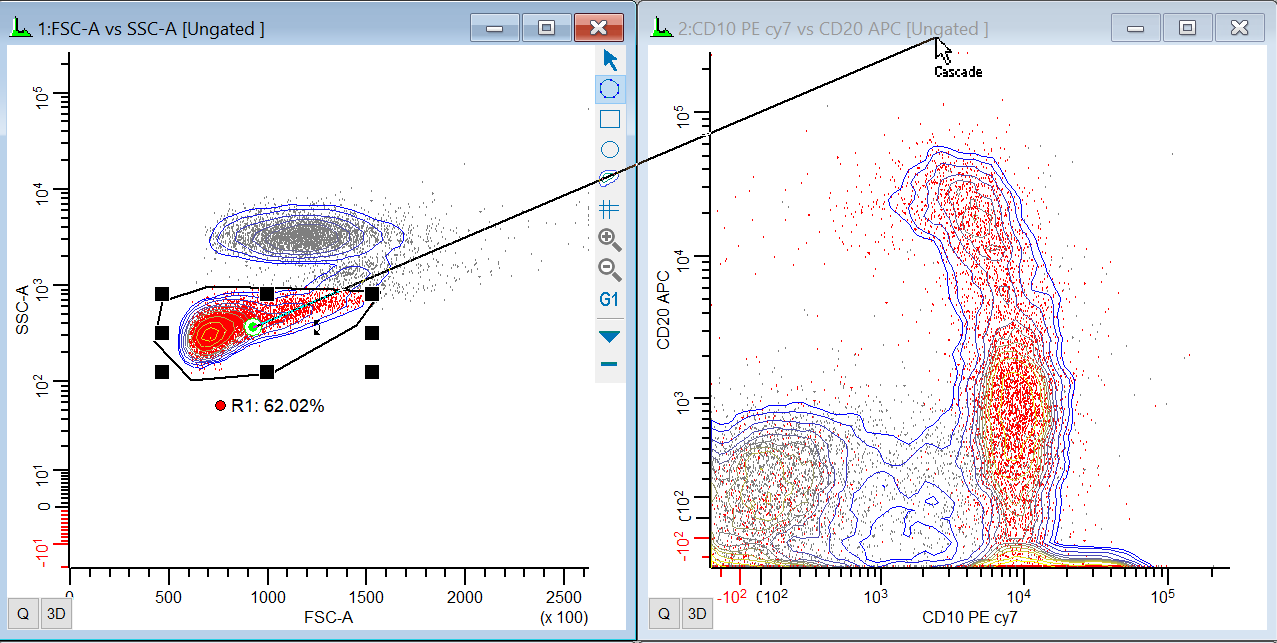
10. Press the Esc key on the keyboard to exit cascade gating mode.
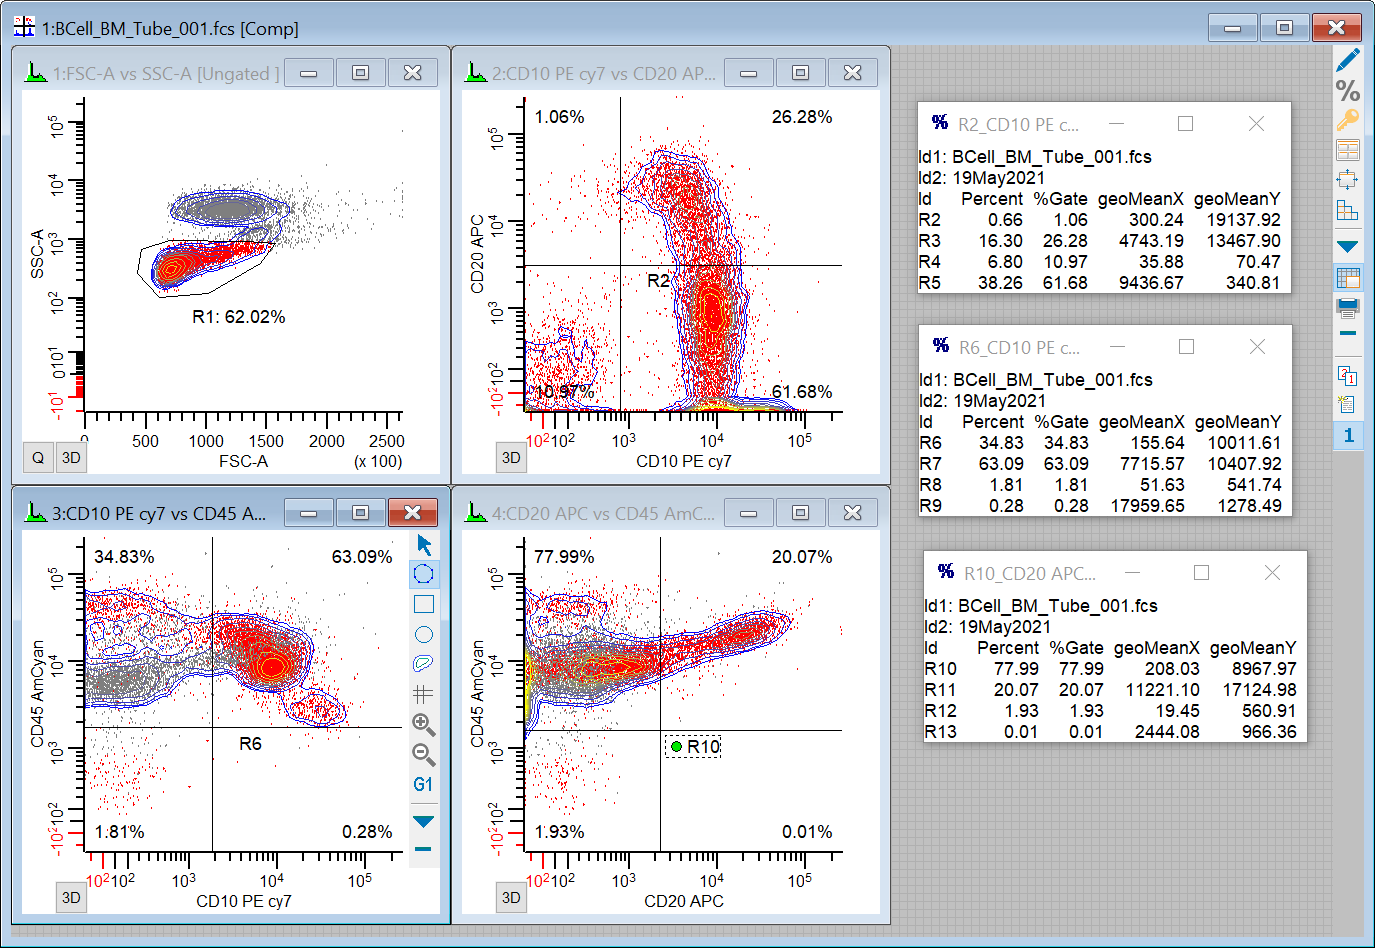
Create QuadStats for statistics
Let's create QuadStats for each of the gated histograms.
11. Click the Q button in the lower-left corner of each of the gated histograms. A QuadStat region will appear on each histogram, and a Results window for each QuadStat will be displayed.
12. Arrange the Results windows so that they are visible and not covering the QuadStats.
You can select the statistics that are shown in a Results window by double-clicking the title bar and selecting the stats. This can be different for each Results window. You can also save your preference for which statistics to show.
13. Adjust each QuadStat. To move the QuadStat, click and hold on the region label in the center of the QuadStat, drag the label to a new position, and release the mouse.
NStat regions are like QuadStats, but are much more flexible and powerful. With NStat regions, you can have any number of rows and columns, and the vertices do not have to remain orthogonal. Use the NStat tool on the histogram toolbar to create an NStat region.
Create a report
At this point, we have a basic analysis setup in place. Let's create a report that can include these graphics and other elements in a page layout format.
14. Click the Report button
on the ribbon bar. Move and size the new report window so that it is not
covering histograms and result windows.

15. Move the mouse over the icon on the left side of the first histogram's title bar. Drag and drop that icon onto the report.

16. Add additional histograms in the same way, dragging and dropping each one onto the report.
17. Drag and drop the results windows onto the report in the same manner.

Reports can also contain keywords, text, alerts, and other graphics. They can be saved for future use, as well as exported to PDF format. See Creating Reports for more information.
Process the files
Since we selected several files for analysis, WinList has created a batch of files to analyze. The batch toolbar appears at the bottom of the WinList window whenever there is a batch of files selected.
18. On the batch toolbar, click the Edit button to display the Edit Batch Options dialog.

The options that appear in this dialog determine what happens when each new file is opened into the setup we have created. Review the options in this dialog. If connected to a printer, enable the Print Report option. Click OK to close the dialog.
19. Click the Next batch item button on the batch toolbar to advance to the next listmode file.

Elements on the report will update automatically as the new data is read in.
20. Adjust the gate in the FCS vs SSC histogram.
21. Click the Next batch item button again to process the last file in the batch.
Other buttons on the batch toolbar allow you to move forward and backward in the batch, as well as to auto-advance through the entire batch list.
When you reach the last file in the batch, the Continue button is enabled.

This allows you to make adjustments to the last file before the analysis is completed. After making adjustments, click the Continue button to finalize the analysis, save and print reports, and perform other batch operations on the last batch item.
Save the protocol
Anytime that you have an analysis setup that you want to be able to re-open, use WinList's Save Protocol or Save Bundle command.
The Save Protocol command creates an XML file that WinList uses to re-create the setup. If you want to be able to use this setup on other computers, the Save Bundle command creates a single file that also contains the listmode data file(s) currently opened and the WinList preferences.
The bundle is also an excellent way to archive the analyses you perform. Simply use the Save As button and choose Save Bundle to archive each data file that you open and analyze. Even better, use the batch toolbar to process your files, and set its options up to save a bundle automatically.
Summary
This brief tutorial has demonstrated how quickly and efficiently WinList helps you to build an analysis setup. In just a few minutes, we were able to create histograms, draw regions, apply gates, and generate QuadStat statistics. We created a new report and dragged the elements we wanted onto the report. And finally, we processed a batch of files through the analysis setup.
Try out some of the additional tutorials to get more details on the powerful features of WinList.
See also:
Tutorials