
Gating is a process of identifying subsets of populations in histograms. Regions are defined and used to "gate" the events that are displayed. Using Boolean expressions, gates can be created that are inclusive rather than restrictive in nature.
WinList is designed to make the common task of creating restrictive gates simple and fast, while at the same time offering open-ended Boolean gating expressions that are flexible and powerful. This tutorial will explore the ease of creating restrictive, "cascade" gates, and look at how to use Boolean gate expressions to identify other populations.
Open a file
1. Click the Open FCS File button on the ribbon bar.

2. In the File Open dialog, navigate to the Samples folder located in the folder where WinList is installed. Select BCell_BM_Tube_001.fcs and click Open.
You can also drag and drop files from Windows Explorer onto WinList. See Drag and Drop for details.
3. The Create Histograms dialog will appear. Click the Cancel button to open the file without creating any histograms.
Draw a histogram and draw a region
There are several ways that histograms can be created in WinList. We'll draw a histogram on this empty data source window to get started.
4. Click and hold the mouse button in the data source window. With the mouse button down, move the mouse to define the size and location for a new histogram window. Release the mouse to finish the histogram drawing operation.
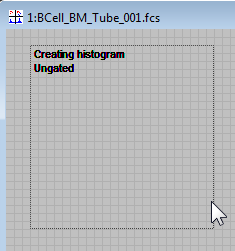
5. The Edit Histogram dialog is displayed. Choose FSC-A for the X Axis and SSC-A for the Y Axis, and then click OK.
On any histogram
window, you can click on the axis label and select a new parameter. You
can also change the parameters that are displayed using the Edit Histogram
dialog.
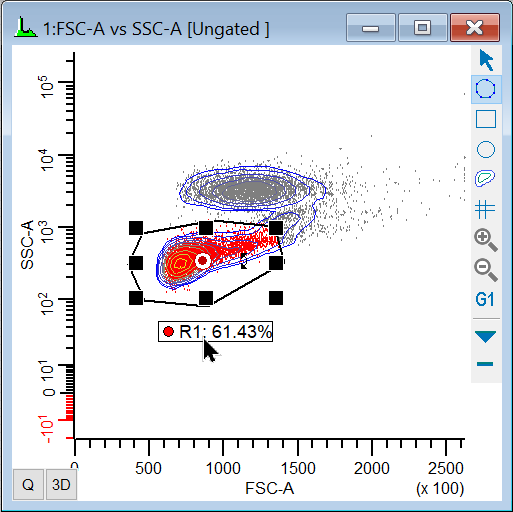
6. Click the Freehand region tool in the histogram toolbar, and draw a region around the population as shown. To draw a freehand region, click next to the population of interest and hold the mouse button down. Drag the mouse around the population as shown. To finish drawing the region, click on the point that appeared when the drawing began.
Create a cascade-gated histogram
Notice the red bull's eye in the middle of region R1. This is the "cascade gate" hotspot, used to gate another histogram on this region.
7. Click the cascade gate hotspot in R1; the red hotspot will change to green. Move the mouse to an empty portion of the data source window. Click, hold, and drag to define a new histogram window.
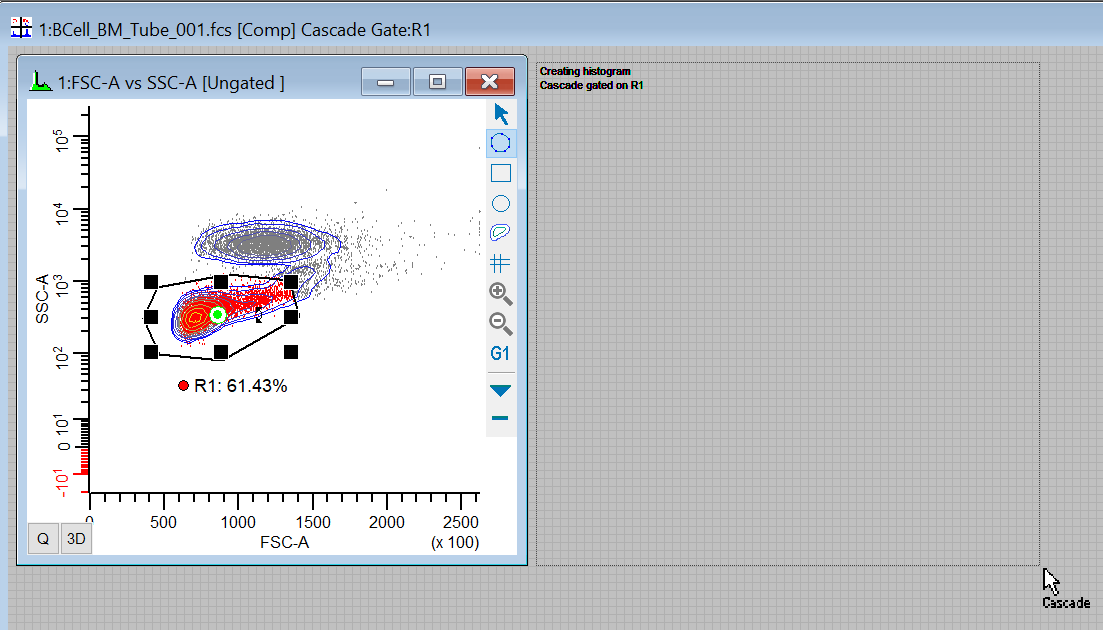
8. Release the mouse button. In the Edit Histogram dialog, select CD10 PE Cy7 for the X Axis and CD20 APC for the Y Axis. Click OK. This new histogram will be gated on R1.
Additional cascade-gated histogram
Now, let's draw a region in this new histogram and use it to create another gated histogram. The new histogram will be gated on R1 and R2.
9. Draw a freehand region in the CD10 PE Cy7 vs CD20 APC histogram to identify the CD20+ events in that histogram.
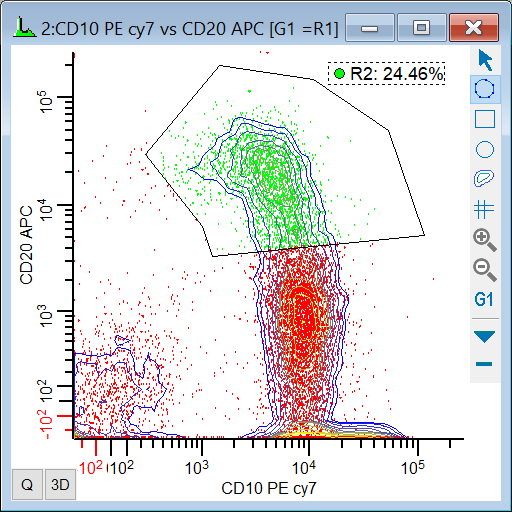
10. Click the cascade gate hotspot in R2. Move the mouse to an empty portion of the data source window. Click, hold, and drag to define a new histogram window.
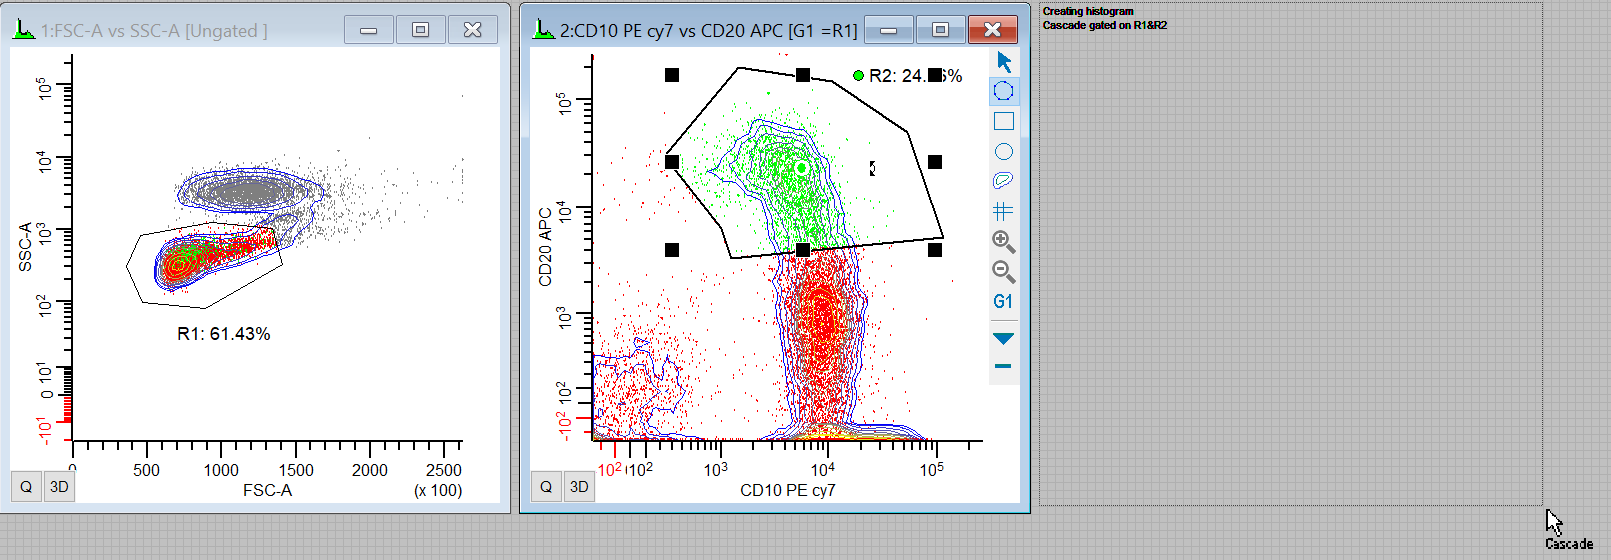
11. Release the mouse button. In the Edit Histogram dialog, select CD10 PE Cy7 for the X Axis and CD45 AmCyan for the Y Axis. Click OK.
This new histogram is gated on R1 and R2, meaning that only the events that are in both R1 and R2 will be displayed. If we continued creating regions and cascade gating in this manner, each new histogram would contain a smaller and smaller set of events. This is an example of restrictive gating.
A Boolean "OR" gate
What events would we see in the CD10 PE Cy7 vs CD45 AmCyan histogram if we looked at events that are in R1 OR R2? The "OR" gate is sometimes called an "inclusive" gate, because events are accepted if they are in either part of the expression. It is often used to define "positives" for a fluorochrome, especially if the regions in the gate expression are parts of a QuadStat.
To create this type of gating condition, we write our own gate expression. Let's create a new histogram and then use the Edit Gates dialog to define an inclusive gate expression.
12. Click, hold, and drag in an empty portion of the data source window to define a new histogram window.
13. Release the mouse button. In the Edit Histogram dialog, once again select CD10 PE Cy7 for the X Axis and CD45 AmCyan for the Y Axis. Click OK.
The new histogram is ungated at this point. We will use the Edit Gate dialog to create a gate expression for R1 OR R2.
14. Click the Edit Gates button on the ribbon bar to display the Edit Gates dialog.

15. Select the "G5" gate in the list. In the Equation edit box, type R1. Then click the Or button and type R2. Click the OK button to close the Edit Gate dialog.
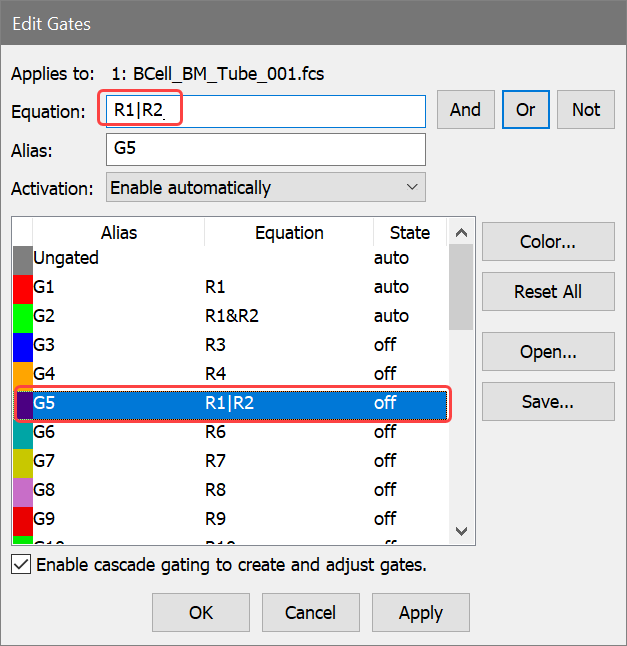
You can also type the "|" character instead of clicking the "Or" button. Similarly, you can type the "&" character instead of clicking the "And" button, and type the "!" character instead of the "Not" button.
At this point, we have edited the gate expression for gate G5 so that it will include any events that are in either R1 or R2. Now we need to apply this gate to our new histogram.
16. Click the Gate tool button on the histogram toolbar and select the G5 gate from the list to apply the new gate.
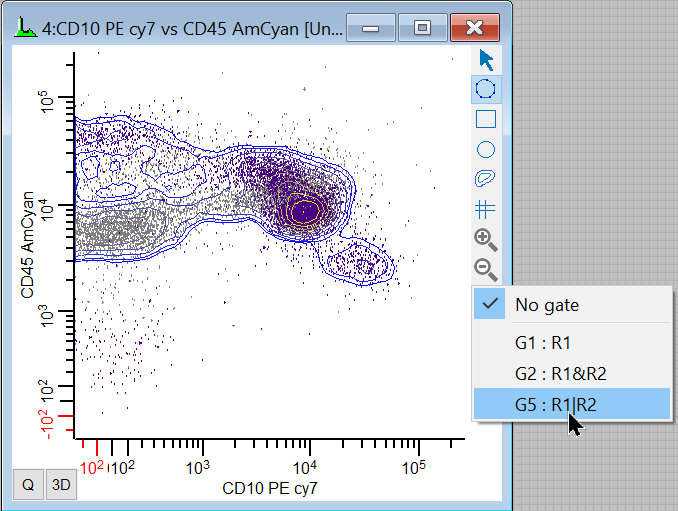
There are other ways to apply a gate to a histogram. When the Edit Gate dialog is displayed, select the gate that you want to apply and then click the title bars of the histograms that you want to gate. This is a fast way to apply a gate to many histograms at once.
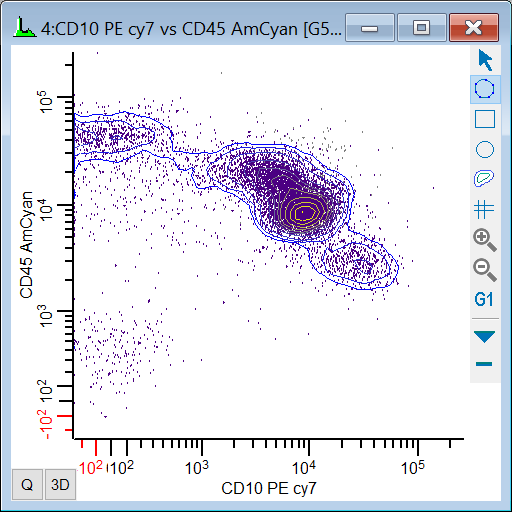
As you might guess, the histogram gated on the "OR" gate contains more events because of the inclusive nature of this gating expression.
The Boolean "NOT" operator
There are certain cases where it is easier to define what you want by defining what you don't want. For example, if you have drawn a region that identifies fragments of cells or debris, you might want to see all events that are not debris. This is where the Boolean "NOT" operator is used.
Let's define a gate that includes all events that are not in R1.
17. Click the Edit Gates button on the ribbon bar to display the Edit Gates dialog.
18. Select the "G6" gate in the list. In the Equation edit box, delete the current equation. Click the Not button to insert the "NOT" operator. Type R1. Leave the dialog open.
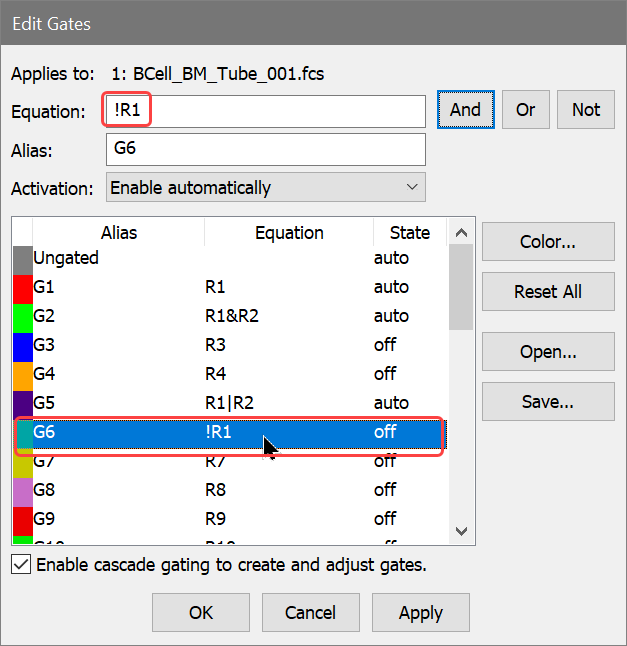
19. With G6 selected in the Edit Gate dialog, click on the title bar of the last histogram. The histogram's title bar will change to show the new gate name. Click OK to close the Edit Gate dialog.
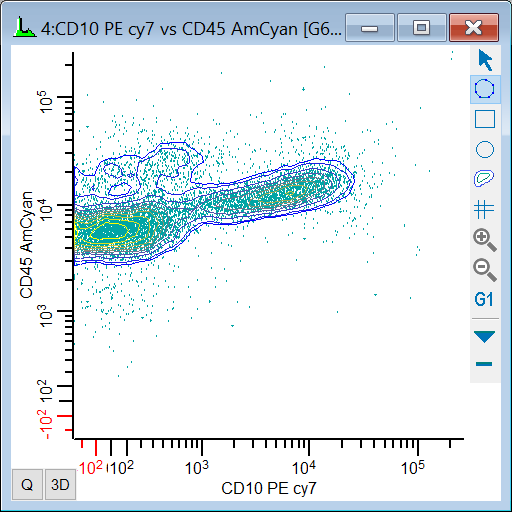
The events now shown in the histogram are all those that are not in region R1.
More complex Boolean expressions
We have barely scratched the surface of what you can do with Boolean gate expressions. For example, let's suppose that you want to exclude debris, defined by R1, and include events that are in either of 2 other regions, R2 and R3. The gating expression would be:
Not R1 And (R2 Or R3)
In WinList's syntax, this would be written:
! R1 & (R2 | R3)
WinList allows you to use parentheses to define the order of operations.
Be aware that if you use "NOT" later in the gate expression, it is must be preceded by "OR" or "AND". For example, if we rearrange the expression above so that "!R1" is at the end of the expression, it would read this way:
(R2 | R3) & !R1
You can also use other gates in a gate expression, which is very handy when your gate expressions are lengthy. For example, if you have gate G1 defined as:
(R2 | R3) & !R1
You can reference G1 in other gate expressions, such as this one for G2:
G2 = G1 & R4 & R5
The gate expression is expanded and surrounded with parentheses when it is evaluated. Here's the expanded form of G2 in this example:
((R2 | R3) & !R1) & R4 & R5
Summary
In this section, we've taken a look at a number of ways that you can create and apply gates with WinList. Cascade gates are created and applied automatically when you click on a region's cascade hotspot and draw a new histogram (or click on an existing histogram). Cascade gates use the Boolean "And" to create restrictive gates.
We also examined how you can define gate expressions that use the Boolean "Or" and "Not" operators, and how parentheses can be used to create sophisticated gating expressions.
See also