
This command is found on the Home tab of the ribbon bar, or in the Options menu when using the toolbar and menu display.
This dialog manages gates for one data source. You can redefine gates, change colors, assign them to histograms, save and open them from disk.
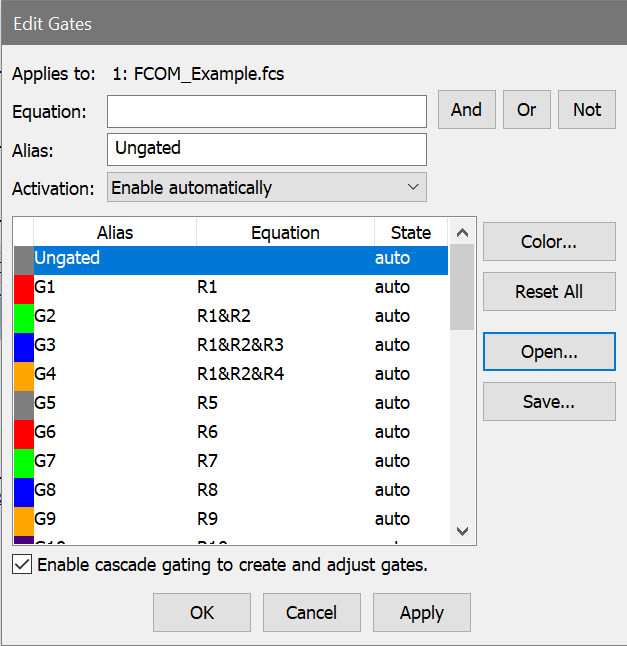
Applies to
The data source that this gate dialog relates to is shown here.
Equation
This field contains the gating expression. See Writing a gate containing a Boolean region expression below for a detailed explanation.
And, Or, and Not Buttons
These buttons aid in the writing of Boolean equations. If you push the And button, a & will be inserted at the current location in the Equation edit box. The Or button inserts the | character and the Not button inserts the ! character.
Alias
Each gate can have an alias. The alias is the name that appears when the gate is shown in other locations in the program.
Activation
This field controls how WinList activates the gate.
"Enable automatically" will turn the gate on when all of the regions referenced by the Equation have been created. The gate will be disabled if any of the regions are missing.
"Always enabled" causes the gate to remain enabled even if some of the regions in its Equation are missing.
Gate List box
The gate name, equation, activation, and color assignment are shown in this list box. The number of gates is set in the Edit Program Controls dialog box.
Click an entry in the list to select the gate for editing.
Click the color swatch to select a new color for the gate. Double-clicking the gate will toggle it between "Enable automatically" and "Always enabled".
To assign a gate to one or more histograms, select the gate in the listbox and click the histogram title bars.
Enable cascade gating to create and adjust gates
This check box turns the Cascade Gate system on and off. When Cascade Gating is on, gate expressions are automatically adjusted based on the gates that are applied to different histograms and the regions in those histograms.
Color
Selects a color for the selected gate.
Reset All
This option puts the system in its default condition where all gates are off and are associated with R1, R2, ... Rn respectively.
Open
This option retrieves the contents of the gate list from disk.
Save
The contents of the gate list box can be saved to disk when this option is selected. This option may be useful if you have created a number of complex gates and you don't want to waste time re-creating them each time. It is important to realize that this option does not save the regions themselves (see Region List) and it does not save the actual absolute colors (see Show/Edit Palette).
Cancel
The Cancel button allows you to exit with no changes.
OK
Click OK to accept the changes you have made.
Apply
This button acts like the OK button, except that the dialog remains open.
Writing a gate containing a Boolean region expression
Normally when working with the gates, each gate is assigned a single region. For example, gate 1 or G1 is assigned to region 1 or R1. This initial setup can be changed extensively to better serve your gating needs. When a histogram is assigned a gate, say G1, and that gate is associated with R1 and the gate is active, the program will only allow those events that are inside R1 to be displayed in the gated histograms.
While this system allows some powerful gating, you can perform much more complex analytical gating. For example, if you wanted a histogram to be gated on two regions, say R1 and R2, and you wanted the histogram associated with this gate to have access to events that satisfy both regions, you could create a gate associated with the expression R1 & R2. The & symbol tells WinList to look only at events that satisfy both R1 AND R2. Click the And button to insert the & symbol in an expression.
The Boolean expression can be quite complex and may involve several regions. If you wanted to look at events that satisfy either R1 or R2, you would click the Or button. The expression would be written as R1 | R2.
Occasionally it is important to look at events that are NOT within a particular region. To do this we use the ! operator. For example, to look at events that are not in R1, one would write !R1.
The gate expression can be made much more complex if needed by nested parentheses. For example, the gate expression
!(R1&R2) | R3
is true for events that do not satisfy both R1 and R2 or that satisfy R3. As you can see, these Boolean expressions can be quite powerful. A typical use of complex gates is to find rare events that satisfy a number of gating criteria. You can create a gate such as R1&R2&R3&R4 and turn on event coloring just for this gate. The events that satisfy all these regions will be highlighted by the gate color.
You can also use other gates in your gate expressions (as long as they do not create circular references). This is a convenient way to make your gate expressions more readable. For example, suppose that gate G1 is defined as (R1&R2)&!(R3&R4). We can use G1 as a shorthand for the expression in other gates:
G2 = G1 & R6
which expands to
((R1&R2)&!(R3&R4)) & R6
when it is evaluated.
In summary, WinList's Boolean operators include & (AND), | (OR), and ! (NOT). The operands are the regions defined as R1, R2, ... Rn. The steps to create a more complex gate expression are to first choose the gate that needs to be redefined, then to write the Boolean expression in the edit box, and finally to press the Replace button. To assign that gate to a particular histogram, click the histogram's title bar with the gate you want selected in the Edit Gates dialog box. When the OK button is selected, the new gate will be applied to all the gated histogram. You can save the gates at any time for future use by using the Save option.