
To create a new overlay window, click the Overlay button on the Home tab of the ribbon bar. If you are set up to use a menu and toolbar instead, choose Overlay from the Create menu.
Overlay windows are a great tool for graphically comparing a set of 1P or 2P plots. You can set up different views and select a wide variety of graphical options. Overlays organize plots - typically from different files - so that you can easily see the similarities and differences among them.
A new, empty overlay window will appear.
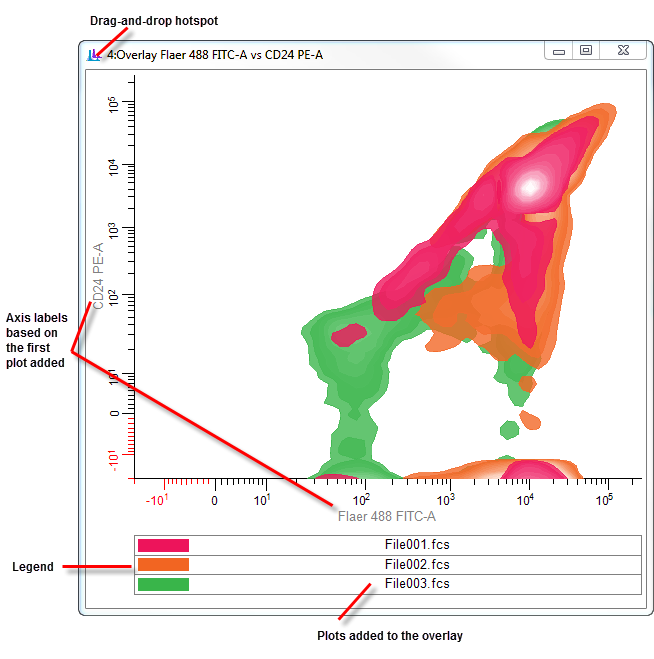
To add a plot to an overlay, drag a histogram by the icon on the left side of its toolbar and drop it onto the overlay. The first plot that is added to an overlay determines whether it is a 1P or 2P overlay window. It also determines the axes that will be displayed. If you subsequently add a plot with different parameters than the first plot, the overlay will ask if you really intend to do so.
To remove a plot from an overlay, click the item in the legend to select it. Then, right-click and choose Delete Item from the context menu.
To change the order of items in the overlay, click the item that you want to move in the legend, and then drag the item to the desired order in the legend. When the mouse is released, the overlay will redraw with items in the new order.
To edit the properties of the overlay or overlay items, right-click the overlay and choose Edit from the context menu. The Edit Overlay dialog will be displayed. This is where you can choose the kind of overlay you want and set the graphical properties.