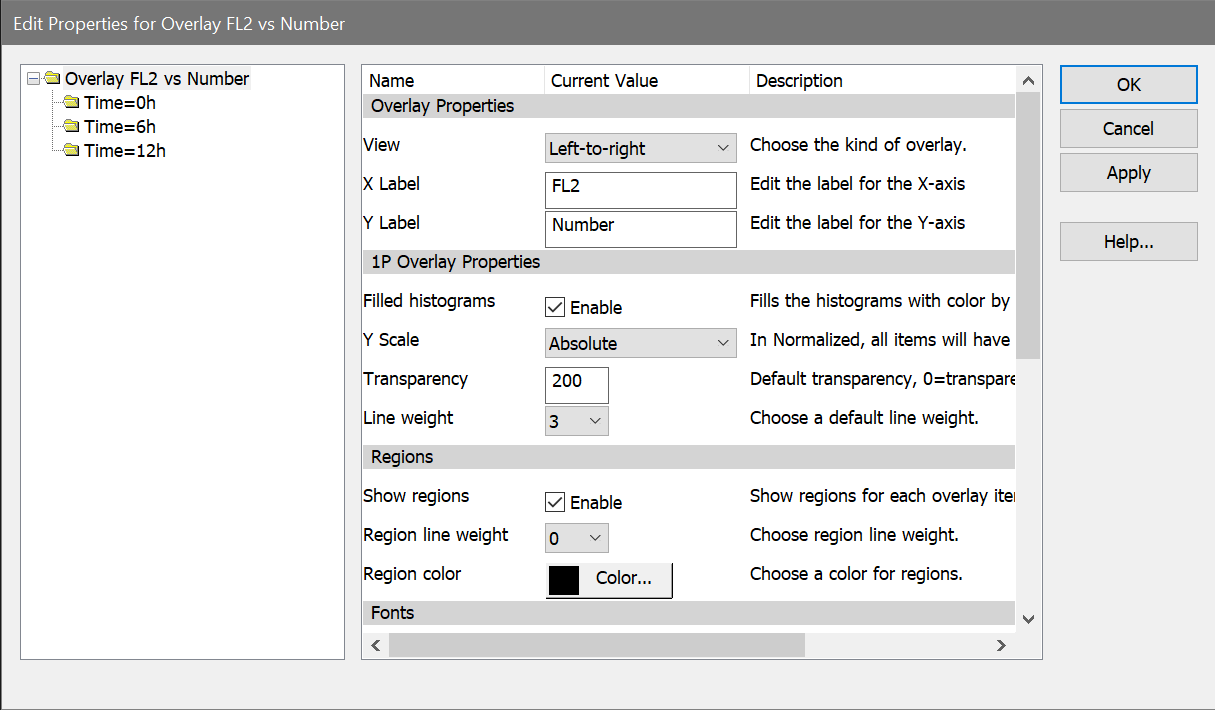
This dialog determines the display properties for an overlay window. It is accessed by double-clicking an overlay title bar, or by right-clicking the overlay and choosing Edit from the context menu.
The options shown in the dialog differ, depending on whether the overlay is for 1P or 2P plots. The image below shows the 2P overlay dialog.
Overlay Properties
View
There are 4 viewing modes for overlay windows.
| Offset | 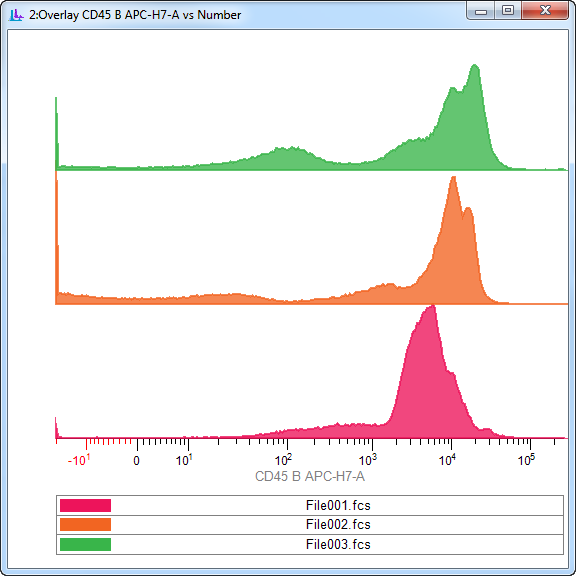 |
| Offset overlapped | 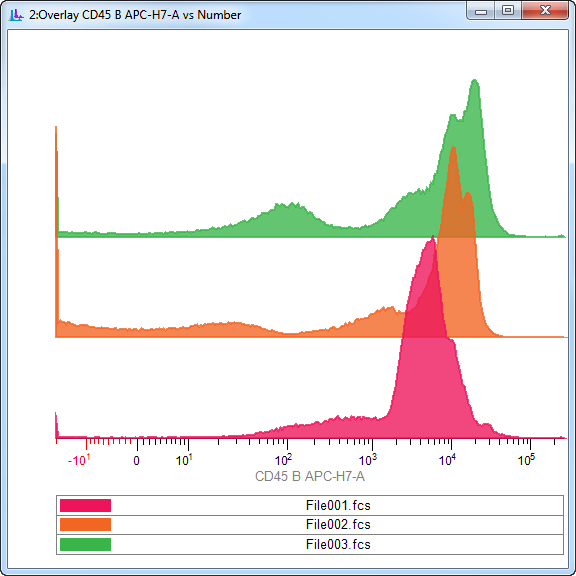 |
| Left-to-right | 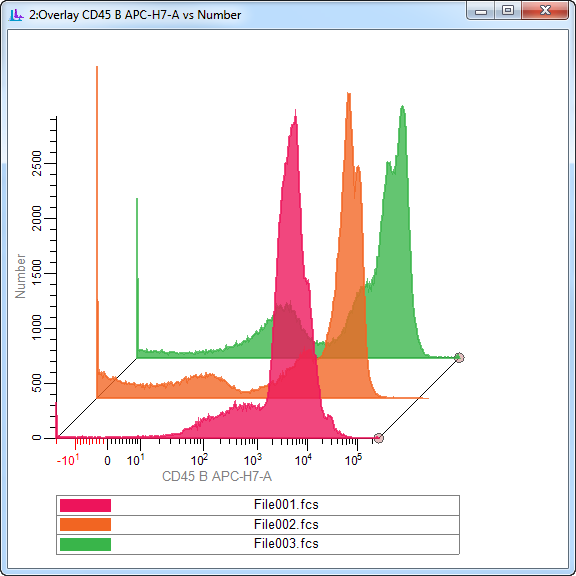 |
| Overlaid | 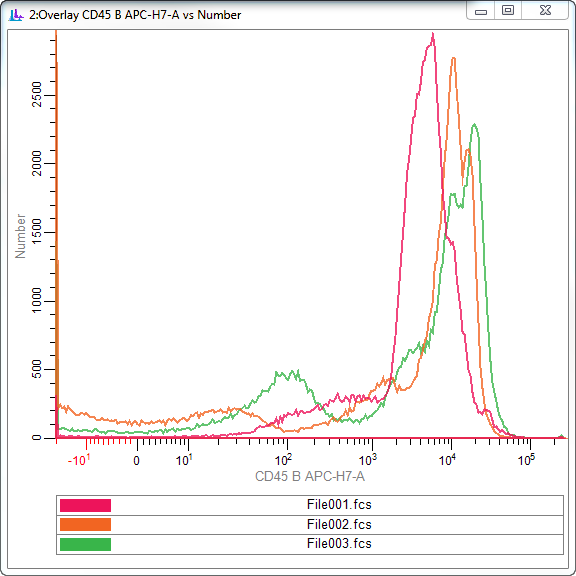 |
X Label
This is the label that appears on the X axis of the overlay.
Y Label
This is the label that appears on the Y axis of the overlay.
1P Overlay Properties
Filled Histograms
Enable this option to draw 1P histograms filled with the selected color. Disable the option to draw 1P histograms with no fill.
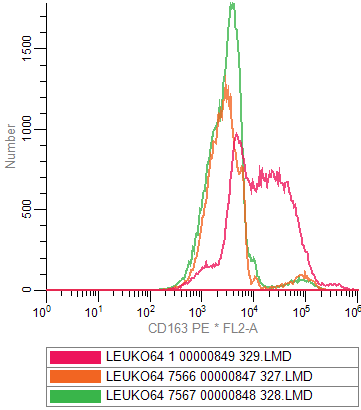
Y Scale
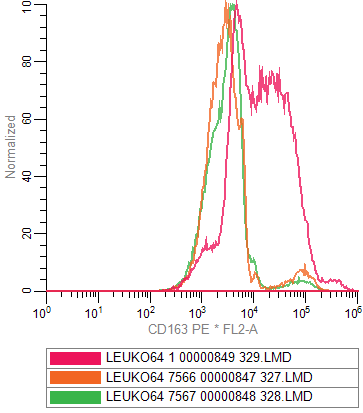
Choose Absolute or Normalized. In Absolute scaling mode, each 1P histogram in the overlay is drawn to its actual height, and the Y axis scale of the overlay is based on the tallest histogram in the overlay. In Normalized scaling, each 1P histogram is drawn to 100% of its own scale - they will all appear to have the same height - and the Y axis switches to show a 0 to 100 scale. Normalized scaling is useful when you are more interested in the intensity shifts of the overlay items rather than the actual areas.
| Absolute | Normalized |
 |
 |
Transparency
This value determines the transparency of the plots. A value of 0 makes the plots completely transparent; a value of 255 makes the plots opaque.
Line Weight
Select a line weight for the outline of the 1P plot.
2P Overlay Properties
Display
The 2P overlay can display Dots or Contours for the plots. Contours will draw faster and are somewhat easier to interpret.
2P Contour Properties
These properties are used when Contours is the selected Display option. The color assigned to each item in the overlay is used as the base color for the contours. Colors transition to white for the highest contour.
Probability interval
This option determines the number of contours that will be drawn, based on the separation between them.
Base contour
This option determines the probability for the lowest contour.
Fill contours
Enable this option to fill the contours with color. Disable the option to draw unfilled contours.
Smooth
Enable this option to smooth the contours.
Smoothing span
With Smooth enabled, this setting controls how much smoothing is applied. Higher values create smoother contours, but show less detail.
Transparency
This value determines the transparency of the contours. A value of 0 makes the plots completely transparent; a value of 255 makes the plots opaque.
Line Weight
Select a line weight for the outline of the contours.
2P Dot Properties
These properties are used when Dots is the selected Display option. The color assigned to each item in the overlay is used for the dots.
Dot size
Select a size for the dots.
Number
Select the number of dots to display for each overlay item.
Regions
These properties determine whether regions are included in the overlay.
Show regions
Enable this option to show the regions for the overlay items.
Region line weight
Select the line weight for regions.
Region color
Select the color to use for the region line.
Fonts
Legend font
Select a font to use for the legend.
Label font
Select a font to use for the axis labels.
Number font
Select a font to use for the numbers on the axes.
Region font
Select a font to use for the region labels in the plots.
Display Options
Show legend
Enable this option to display the legend with colors and item names on the overlay. The legend appears at the bottom of the overlay window. It is also used to re-order items in the overlay.
Show X axis
Enable this option to display the X axis.
Show Y axis
Enable this option to display the Y axis.
Show grid
Enable this option to show a grid based on the major tics of the axes.
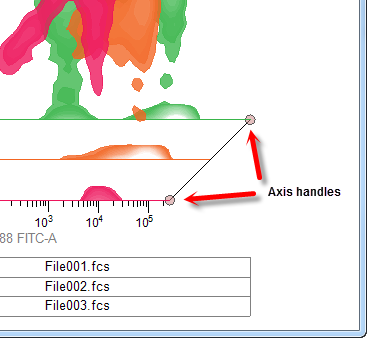
X-axis size, Y-axis size
These options are only used for Left-to-right viewing mode. They control how much of the width or height of the plot area is used by the axis. By default, these are 80% (0.80). You can manually edit these values to change the perspective in Left-to-right viewing mode. You can also edit these directly on the Left-to-right overlay window by moving the small handles at the right side of the plot.