WinList can create a number of different types of regions. Each is created in a different way as described below.
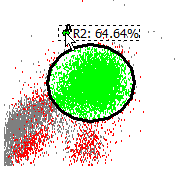
The way regions are moved, resized, and deleted is common to all region types. Move a region by clicking on the region's label, and then dragging the label to a new location. To move the label without moving the region, click on the left portion of the region label, called the hotspot, and drag the label.
Resize a 1P or 2P region by clicking on the region's label to activate the region. Sizing handles are displayed. Click on one of the handles and drag it with the mouse to adjust the size of the region.
Delete a region by clicking on the region label, and then pressing the Delete key on the keyboard. You can also delete regions (except for NStat regions) by dragging the region label off the left edge of the histogram and releasing the mouse.
1P Region Creation
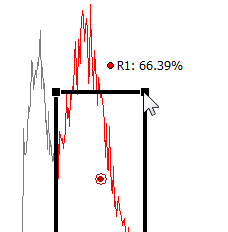
To define a new region in 1P histograms, click on the histogram title bar to activate it. This will also display the histogram toolbar. Make sure that the Range tool is selected in the histogram toolbar. Click and draw on the histogram to define the left and right boundaries of the range, and release the mouse button when finished.
1P regions can automatically position themselves relative to the median of the histogram that contains them. The attribute can be enabled in the Edit Properties for 1P Region dialog box.
2P Region Creation
In 2P histograms, you can define many types of regions, including free-hand, contour, rectangular, elliptical, and NStat. To create a new region, first click on the histogram's title bar to activate it and show the histogram toolbar. Choose the type of region you want from the toolbar that appears on the right side of the histogram.
To draw a free-hand region, select the Free-hand tool, then click, hold, and drag the mouse to create additional points. Finish the region by releasing the mouse on the first point that was created. Free hand regions can also be created using the point-and-click technique to define each point in the region. Start this method in the same way described above, and then click the mouse button for each point you want to define. Finish the region by clicking on the first point that was created.
To create a rectangular region, select the Rectangle tool. Click and hold the mouse button to create the first corner of the rectangle. Move the mouse and release the button to define the opposite corner of the rectangle.
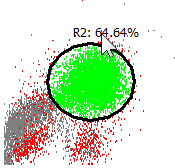
To create an elliptical region, select the Ellipse tool. The ellipse is created in the same way as the rectangle region described above.
To create a contour region, select the Contour tool. With a Contour region, a bounding rectangle is defined with the mouse, just as with the Rectangle tool. Once that rectangle is defined, WinList computes a contour on the data within that rectangle. Each time the data in a histogram changes, the contour region will recompute based on the data in that rectangle.
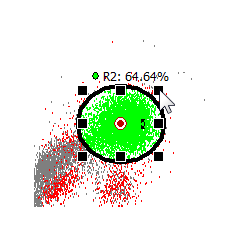
To size a 2P region, first click on the region label to activate the region. Sizing handles will appear around the perimeter of the region. Drag a handle to resize the region.
To rotate a 2P region, first click on the region label to activate the region. Along with sizing handles, a small double-headed arrow will appear to the right of the region's center. Drag this handle to rotate the region.
The Edit Properties for 2P Region dialog is displayed when you double-click a 2P region label.
A 2P region can also display all or some of its vertices, allowing you to adjust one or more points in the region. To display the vertices, display the Edit Properties for 2P Region dialog and enable the Show Vertices option. Each vertex point can be moved with the mouse.
2P regions can automatically position themselves relative to the median of the histogram that contains them. This attribute can be enabled in the Edit Properties for 2P Region dialog box.
NStat and QuadStat Region Creation
An NStat region is an array of adjacent regions with a defined number of rows and columns on a 2P histogram. A QuadStat region is a particular type of NStat region with 2 rows and 2 columns. NStats are very useful when you need a set of adjacent regions that must move together.
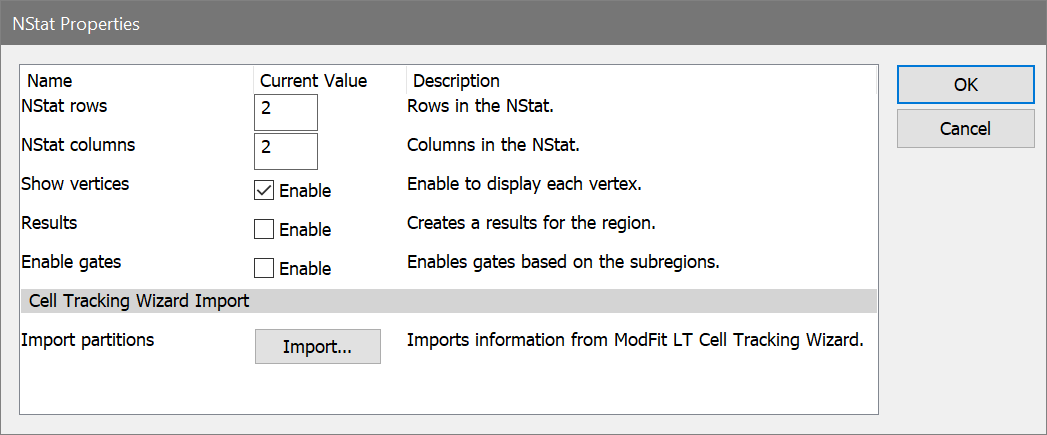
To create an NStat region, click the NStat tool in the histogram toolbar. The NStat Properties dialog is displayed, allowing you to select the number of rows and columns for the NStat. Select the options you want for the NStat and click OK to finish the creation process.
The Edit Properties for NStat Region dialog is displayed when you double-click an NStat region label. Click on the region label and press the Delete key to delete these regions.
An NStat region can display its vertices, allowing you to adjust individual points in the region. To display the vertices, display the Edit Properties for NStat Region dialog and enable the Show Vertices option. Each vertex point can be moved with the mouse.
Region Array Creation
To create an entire set of individual, independent regions at once on a histogram, use the Create Region Array option in the Create menu. This command can create sets of 1P or 2P regions, depending on what histogram is active at the time.