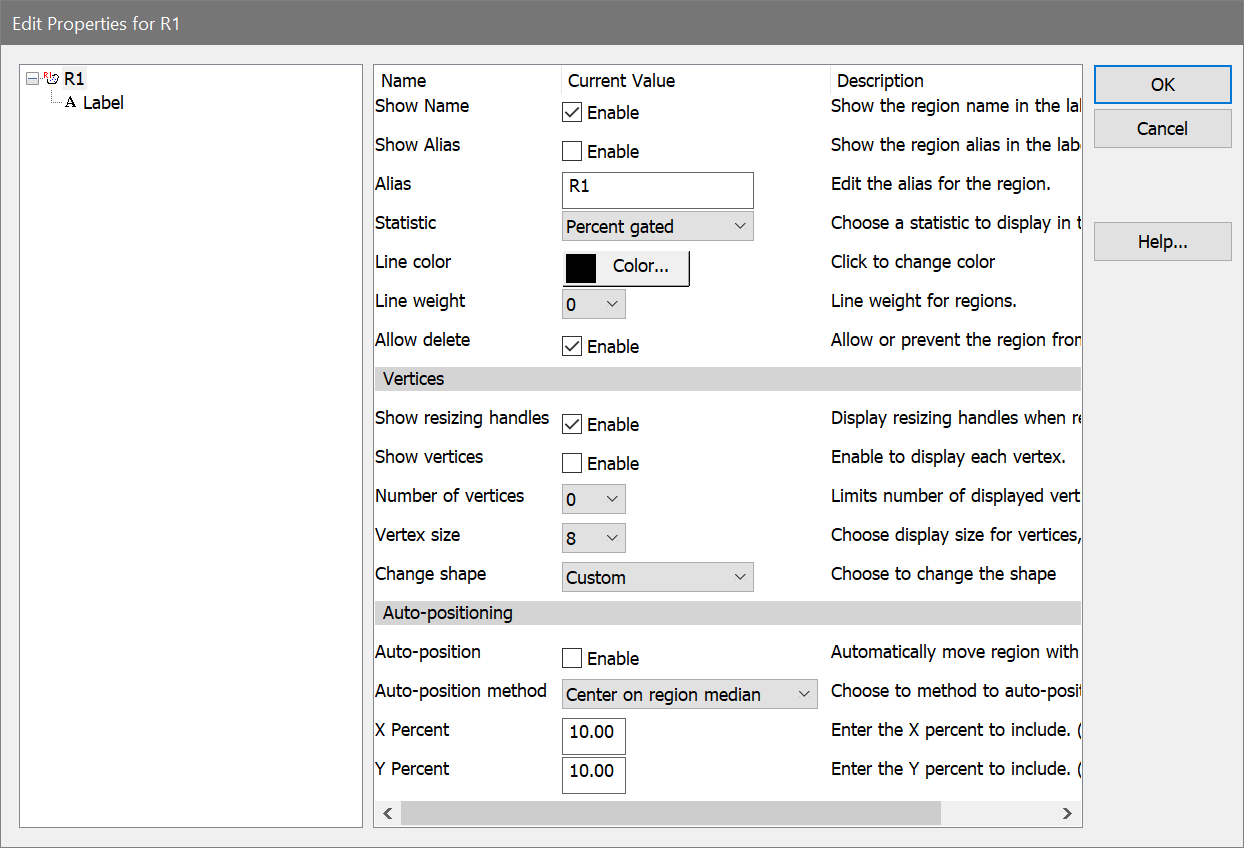
This dialog can be displayed by double-clicking the mouse on the label of a 2P region, or by right-clicking the label and choosing Edit Properties.
Default properties for regions are set in the dialog found in the Preferences dialog, found in the Options menu.
Elements in the tree
Region
Select the region in the tree on the left to edit the properties of the region.
Label
Choose Label in the tree on the left to edit the font, background color, and transparency for the region label.
Properties
Show Name
Enable this checkbox to display the name of the region.
Show Alias
Enable this checkbox to display the alias of the region.
Alias
This edit box allows you to edit the alias of the region.
Show Statistic
Select a statistic to display in the region label. No statistic, Percent Gated, Percent Total, and Region Events are the statistics that can be selected.
Line color
Click this button to choose a different color for the region.
Line weight
Select a line weight from the list of options. Larger values are heavier line weights.
Allow delete
This option determines whether a region can be deleted by the user. When enabled, regions can be deleted by clicking on the region label and pressing the Delete key on the keyboard. Some regions can also be deleted by dragging them off the left or bottom edge of the histogram. Uncheck this option to protect a region from being deleted accidentally. Any region can be deleted using the Region List dialog box, even if the Allow delete option is disabled.
Vertices
Show resizing handles
Enable this option to display resize handles on the region when it is active. Resize handles form a bounding rectangle around a region and can be used to adjust size or shape of a region. The handles are hidden when the region is not selected.
Show vertices
Enable this option to display the individual points that comprise the region. When displayed, the vertex points can be moved individually.
Number of vertices
This option allows you to choose how many of the region vertices to display when the Show Vertices option is enabled. Choosing 0 displays all vertices. Other choices include 5, 10, and 20 vertices. By displaying a subset of the vertices, it is possible to adjust regions with many vertices using just a few control points.
Vertex size
This option determines the size of the region's vertices, if they are displayed.
Change shape
This option allows you to change the shape of an existing region to either an ellipse or a rectangle.
Auto-positioning
Auto-position
Enable this option when you want the region to automatically adjust its position relative to data in the histogram. The region will center itself on the X and Y medians or modes, depending on the selection in the Auto-position method option below. When you move a region with the auto-position property enabled, you offset its auto-position location relative to the data. When the data changes in the histogram containing the region, the region will adjust its position relative to the new data.
The auto-position property will be disabled in a few circumstances where it is invalid. When a region is used in a self-gate on the histogram in which it resides, the property is disabled. Similarly, if a region is a dependent linked region, the property is disabled.
Auto-position method
This option determines what statistic is used when the auto-positioning is enabled for a region. The center of the region is positioned on the specified value. Choose Center on histogram median if you want to track the central tendency of the data or Center on histogram mode to track the location of highest frequency events. Choose Include lower percent to position the region to include events on the low intensity end of the histogram, or Include upper percent to include the high intensity events. Choose Center on region median or Center on region mode to track the central tendency of the data within the region, not the entire histogram.
X Percent, Y Percent
If Auto-Position is enabled and the method is Include lower percent, enter the percentile value where the top and right sides of the region should be positioned. The left and bottom edges will be set at the origin.
If Auto-Position is enabled and the method is Include upper percent, enter the percentile value where the left and bottom edges of the region should be positioned. The top and right edges will be set at the upper boundary.
OK
Click this button to accept changes and close the dialog box.
Cancel
Click this button to close the dialog box and cancel changes.
Help
Click this button to display on-line help for this dialog.