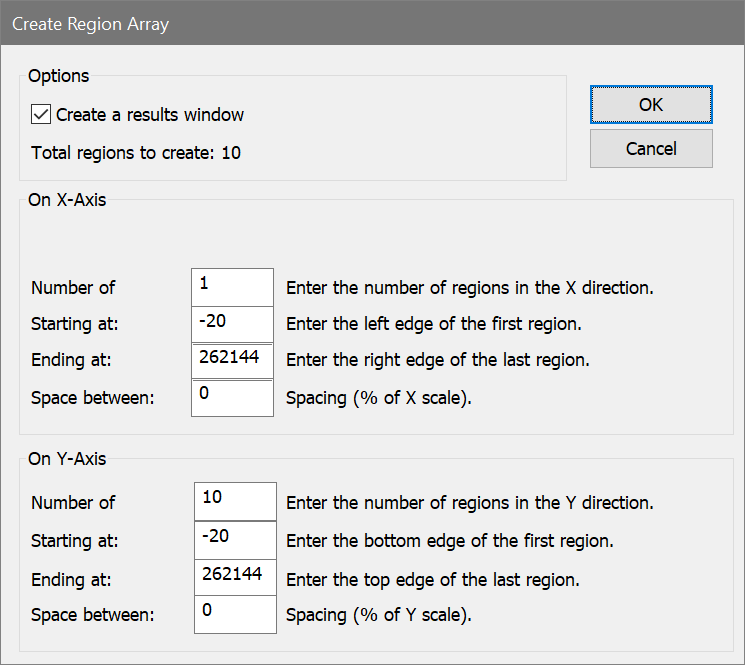
This menu option displays the Create Region Array dialog box, which is used to create one or more rectilinear regions. Use this dialog when you want to create a set of regions spanning a given range of channels.
The main difference between a region array and an NStat region is that the region array creates a set of separate regions. Each region in the region array can be moved independently. The NStat is a collection of regions that are always adjacent and can be moved as a collection. See Regions and Edit Properties for NStat Region for more about NStat regions.
The dialog provides control over the number of regions, starting and ending channels, and the spacing between the regions. A result window can be created automatically for the regions.
Create a results window
Enable this option if you want WinList to create a results window with the statistics for the regions created. Clear the check if you do not want a results window.
Number of regions
Enter the number of regions you want to create in a given direction. For single-parameter histograms, enter the number to create on the X-axis. For two-parameter histograms enter both X-axis and Y-axis values.
Starting at
Enter the value where the first region will begin. Values are in the same units shown on the axis.
Ending at
Enter the value where the last region will end. Values are in the same units shown on the axis.
Space between
If you want the regions to be separated, enter a value in this edit box. The value is in units representing a percentage of the axis, and the same value is used between all regions.
OK
Choose this option to create the region or regions defined by the dialog box.
Cancel
Choose this option to cancel the dialog box without creating any regions or results.
Some of the content of the dialog depends on the properties of the active histogram. If a 2-parameter histogram is active, options are displayed for X-Axis and Y-Axis as shown above. If a 1-parameter histogram is active, only the X-axis options are displayed. In addition, if the 1-parameter histogram contains an FCOM calculated parameter, a special option is added to the dialog.
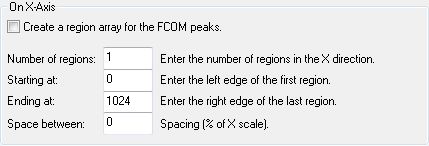
Create a region array for the FCOM peaks
This option only appears if the active histogram is 1-parameter containing an FCOM calculated parameter. It creates a region array for the FCOM histogram, with annotated region labels and color event gating options. See FCOM Region Array options for details.