The "Sync Wizard" is used to analyze data with perturbed populations. It allows you to specify important aspects of your data and constructs a model to match. Once the model is created, you can use the Sync Wizard to run through a set of files, adjusting the model as needed.
You will learn how to start the Sync Wizard, how to adjust the settings used to create the model, and how to analyze your data samples with the model created. You will see how easy it is to use the Sync Wizard to model synchronized cell lines.
Starting the wizard
The files you will use in this tutorial are stored in a folder called "Sync" in the Samples folder under the ModFit LT program folder.
Setting up the model
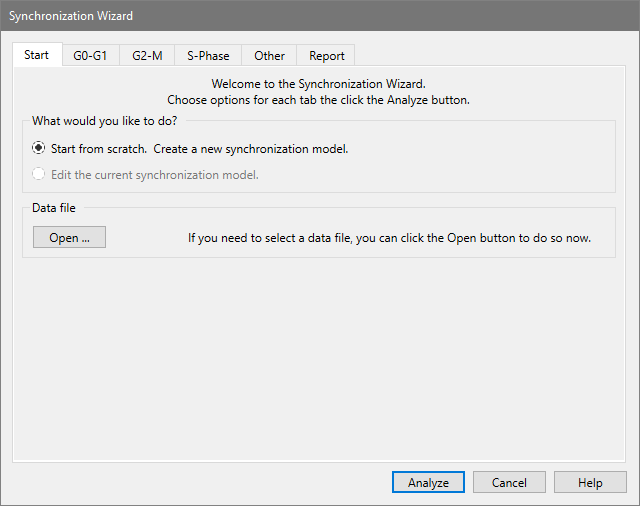
Notice the tabs across the top of the dialog. These tabs are labeled with the categories you can adjust in the model.
The options on the Start tab let you create or edit a model, and also provide an alternate path to open a data file. Since you have already opened the file we want to use and are ready to create a model, you do not need to make any changes to the Start tab.
This tab displays your data file so that you can tell the Sync Wizard where the G0-G1 peak is.
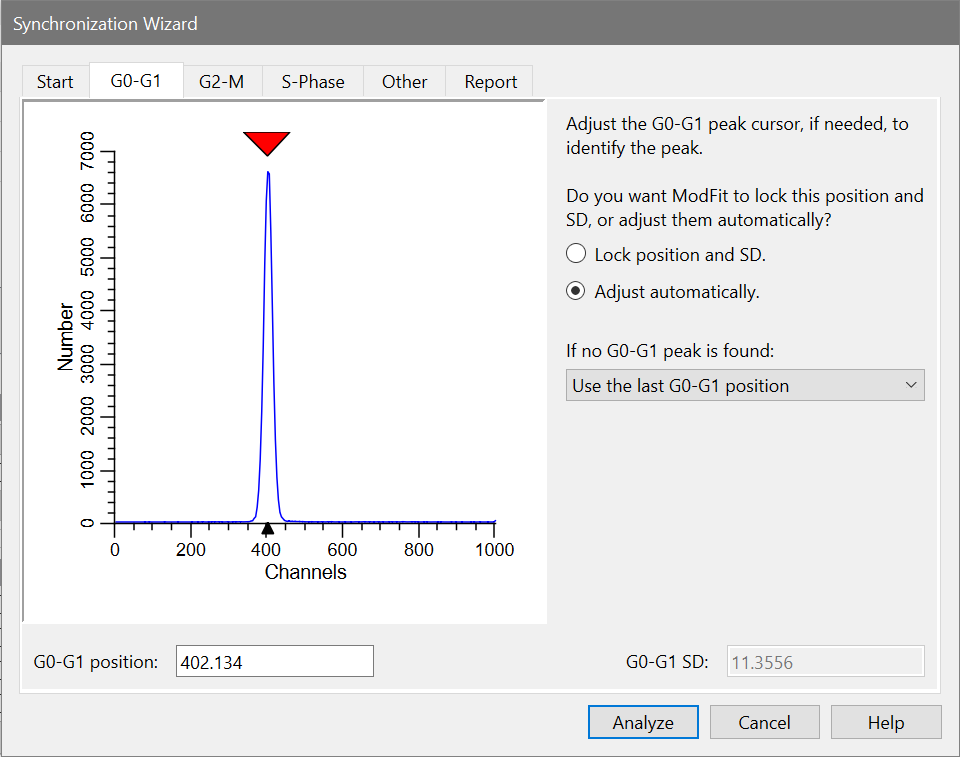
The program positions the red cursor over the first peak it finds in the sample. In this case, it is correctly positioned. If, however, you need to adjust it, you simply click the red triangle and drag it over the G0-G1 peak. If you would rather type in a position, you can edit the G0-G1 position edit box directly.
Now you need to decide whether to let ModFit LT adjust the G0-G1 position during the modeling process, or to lock the G0-G1 position. Here is how to decide.
If your sample has a clearly defined G0-G1 peak and you want the program to look for the best peak position over a range of channels, choose "Adjust automatically." The Sync Wizard will create a range, "G0G1", with boundaries above and below the peak position, centered on the peak. It will look for the peak within the "G0G1" range. If your G0G1 peaks shift from file to file, as long as they fall within the range the program should find them. If the G0G1 peaks shift too much, you can adjust the position or size of the "G0G1" range to account for the shift. In fact, the Sync Wizard will prompt you if it cannot find a peak in the range.
If the peak is not clearly visible or you do not want the program to scan for the G0-G1 peak, you should choose "Lock the position". This setting prevents the program from adjusting the position.
This tab displays your data file so that you can tell the Sync Wizard what the G2/G1 ratio is.
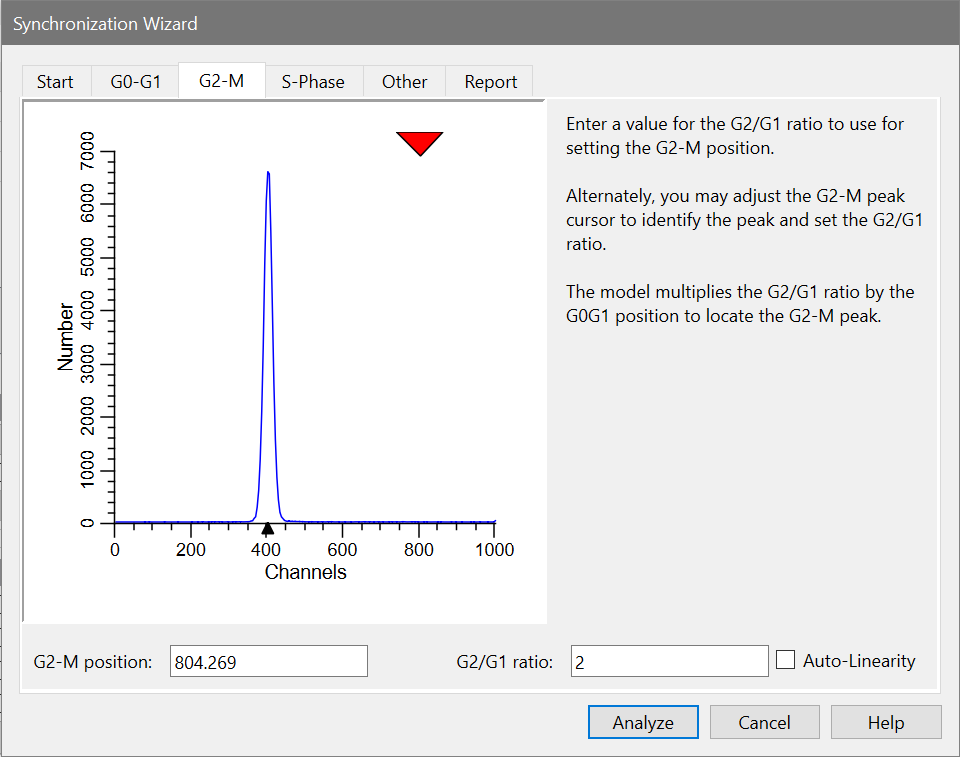
If you know the G2/G1 ratio already, you may enter it directly into the G2/G1 ratio edit box.
If you have a sample with a visible G2-M peak, you can click the red triangle and position it over the G2-M peak. As you move the triangle, the channel position and G2/G1 ratio values update automatically.
The model created by the Sync Wizard will multiply the G0-G1 peak position and standard deviation by the G2/G1 ratio appearing on this tab to compute the G2-M mean position and standard deviation. The position of the G2-M peak is always, therefore, dependent on the position of the G0G1 peak. Similarly, the standard deviation of the G2-M peak is dependent on the standard deviation of the G0G1 peak.
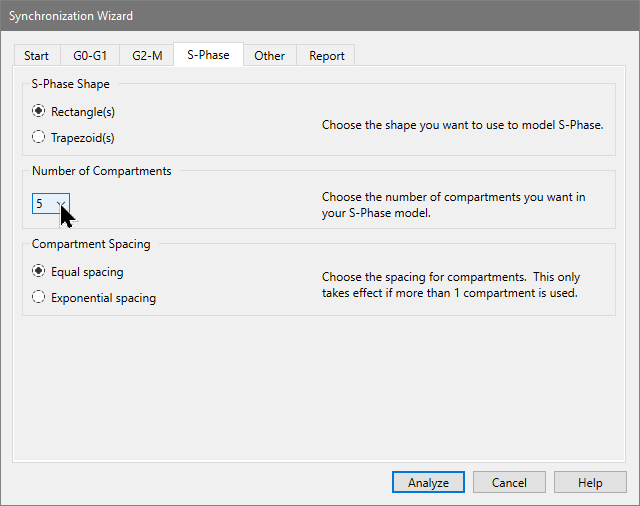
This tab allows you to select what shape you want to use to model S-Phase, how many compartments you want to use, and how to space them if you use more than one. Let's change the setting to 5 equally spaced rectangles.
This tab allows you to enable debris and aggregate subtraction if needed. The default state of no debris or aggregates is fine for this example.
Here you will find options that let you fine tune the information reported by the Sync Wizard model.
Running the model
You are now ready to do the analysis.
The Sync Wizard creates the model based on your choices, sets some ranges on the data, and fires off the analysis of the sample. You should see results similar to these:
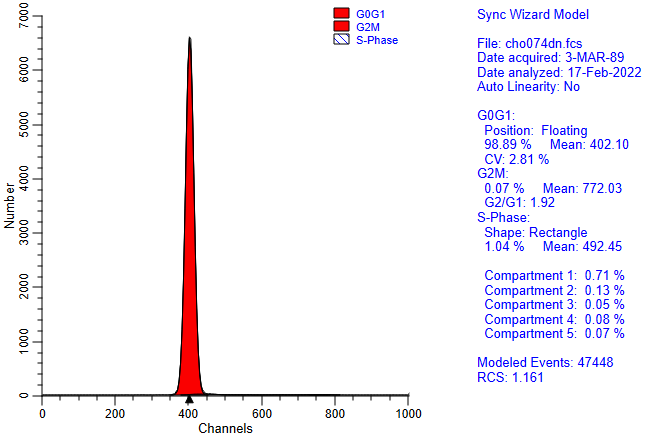
Notice that the S-Phase is reported both as a total percentage and for each of the rectangle compartments in your model. You could at this point add comments, print and save your report. You do not need to do that for the tutorial.
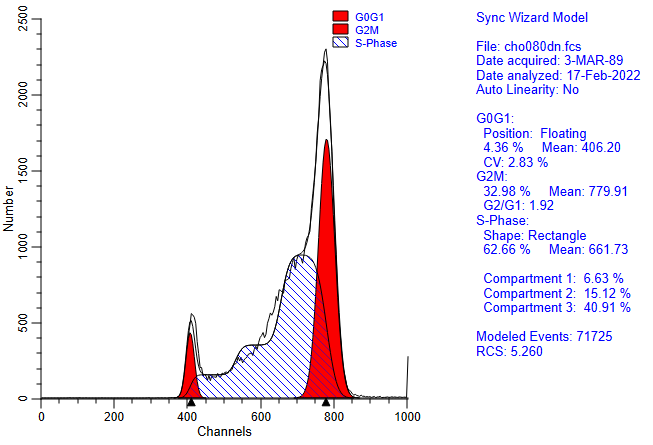
You will also notice a "Wizard" toolbar is now docked at the bottom of the window.
The first button on the toolbar lets you open and analyze a data file in a single operation. The second re-displays the Sync Wizard dialog so that you can edit the model. And the third lets you exit the Sync Wizard. These options are also available on the Home tab of the ribbon.
Adjusting the model
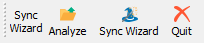
Let's suppose you are interested in just three S-Phase compartments: early, mid, and late S-Phase. Using 3 compartments will make the model more conservative in S-Phase. A more conservative model avoids over estimating the S-Phase population. You can edit the model to do this quite easily.
The sample is analyzed again, this time reporting on just 3 compartments in S-Phase.
Opening and analyzing new data files
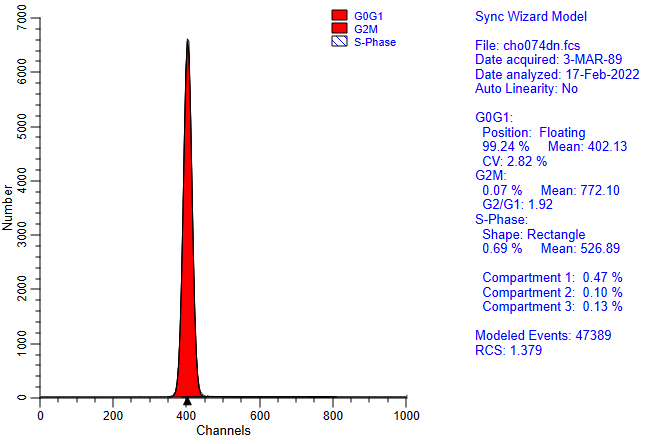
Let's run through several more samples to see what happens to the data.
Summary
The Sync Wizard is a tool designed to allow you to easily analyze samples with perturbed S-Phase and G2-M populations. It is divided into "tabs" that allow you to describe your data and choose options to use in modeling your data.
Once you have created a model with the Wizard, the Wizard toolbar is displayed. It provides shortcuts to opening and analyzing samples, adjusting the Sync Wizard settings, and quitting the Sync Wizard.
Control the model's flexibility by adjusting the shape used and number of compartments in S-Phase. The default setting, 3 rectangles, is good for most cases. The trapezoid shape more closely approximates the shape of the perturbed S-Phase distribution, but it can provide the model too much flexibility.
A Few Additional Notes
If you save a report with the Wizard toolbar displayed and the Wizard active, you will save the current state of the Sync Wizard model in the report. In this way you can create your own "default" settings for the Synchronization Wizard. Simply re-open the report to return to the saved state.
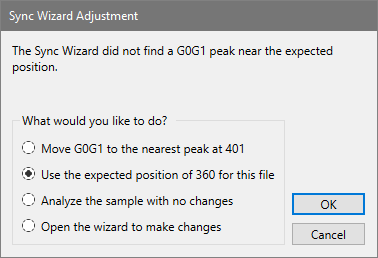
If you allow the model to "Adjust automatically", you can switch to the Range view and adjust the G0-G1 range so that it encompasses the range of channels over which the program can scan for the G0-G1 peak. If the Sync Wizard does not detect any peaks under the G0-G1 range and it is set to "Adjust automatically", it will prompt you with several choices: to move the range, to lock the position, or to cancel the analysis.
See Also: