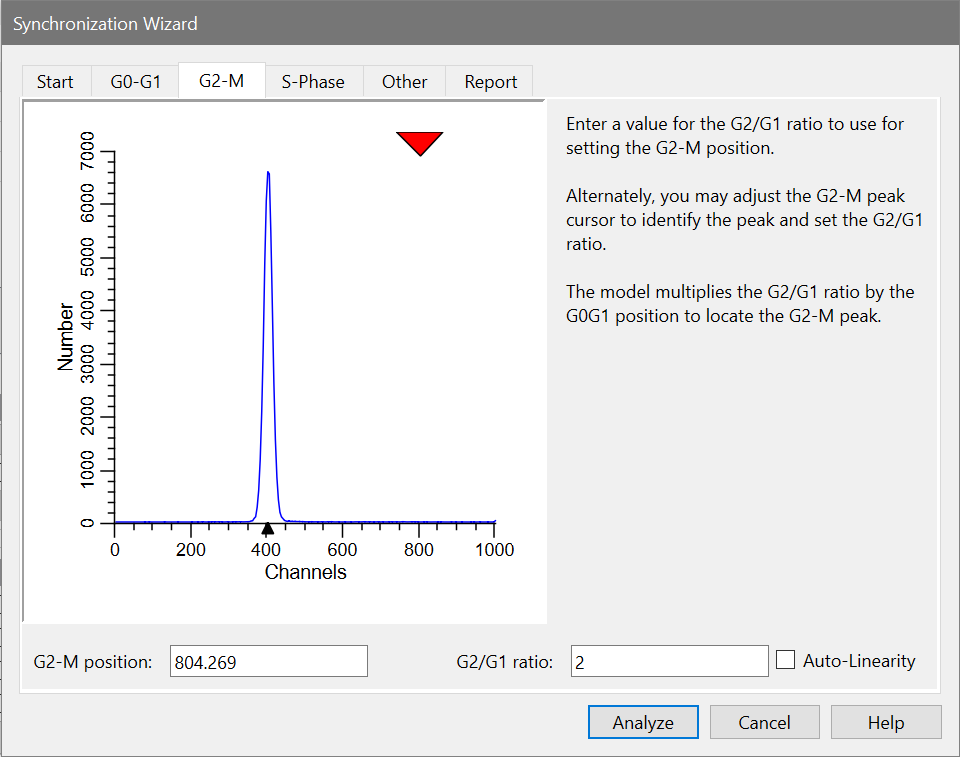
The purpose of this tab is to allow you to identify the G2/G1 ratio. This ratio is used to determine the position of the G2-M peak relative to the G0-G1 peak. A graphic of the currently loaded data file is displayed with a cursor used to identify the position of the G2M peak.
You may adjust the G2/G1 ratio three ways: by entering a new ratio in the G2/G1 ratio edit box, by entering a channel position in the G2-M position edit box, or by dragging the red triangle cursor over the G2-M position on the graphic.
The model created by the Sync Wizard will multiply the G0-G1 peak position and standard deviation by the G2/G1 ratio appearing on this tab to compute the G2-M mean position and standard deviation. The position of the G2-M peak is always, therefore, dependent on the position of the G0G1 peak. Similarly, the standard deviation of the G2-M peak is dependent on the standard deviation of the G0G1 peak.
An option is provided to perform Auto-Linearity on the sample. When enabled, the program will attempt to determine the best G2/G1 ratio for each sample.
