In this tutorial, we'll learn how to use the FCOM parameter to enumerate phenotypes. FCOM is defined as a calculated parameter function in WinList that analyzes any number of phenotypes defined by any number of gates. The best way of explaining this function is to use it. We'll start with a simple example and then discuss how you can extend it in more powerful ways.
Here is the general concept. We are going to open a listmode file and display a few histograms. We will set up some gates to identify the positive events for CD4 PE, CD8 PerCP, and CD3 APC. Then we'll create the FCOM parameter to see the complete phenotype.
Before you begin, make sure you understand the basics of working with WinList. The tutorial WinList Basics is a great place to start.
Open a data file
1. Click the Open FCS button on the ribbon bar and navigate to the Samples folder located in the folder where WinList is installed. Select FCOM_Example.fcs from the list and click Open.
On the PC, you can also drag and drop files from Windows Explorer or My Computer onto WinList. See Drag and Drop for details.
2. When the Create Histograms dialog appears, click Cancel. We will create the histograms one at a time by drawing them on the data source.
This file does not contain any events with values less than 0, so in this case there is no utility to using the HyperLog transformation for it. Let's switch over to use the Log transform for all log-like parameters.
3. Click the Comp button on the ribbon bar to display the Compensation Normalization Toolbox. Select the Transforms tab, and click the --> Log button. You can close the Compensation Toolbox at this point.
Creating histograms and gates
Next, we'll draw 3 histograms on the empty data source window and gate them appropriately.
4. Click, drag, and release the mouse on the data source window to define an area where we want to display a histogram. In the Edit Histogram dialog, choose FSC-Height and Side Scatter for the X- and Y-Axis respectively, then click OK.
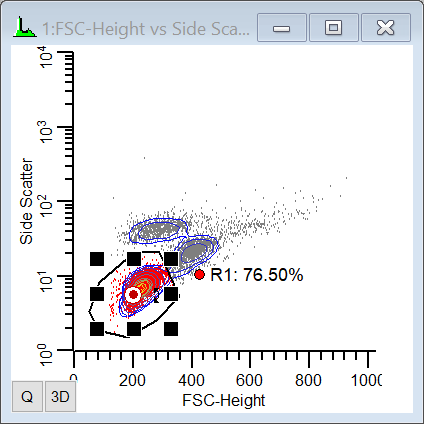
5. In this new histogram, draw a region around the cells of interest as shown below. You can use any region type to do this.

6. Click R1's label to display the cascade hotspot (the red bull's eye in the center of the region), move the mouse to an empty portion of the data source window, and draw a second histogram. In the Edit Histogram dialog, select Side Scatter for the X Axis and CD3 APC for the Y axis, and then click OK.
A new histogram gated on R1 is displayed.
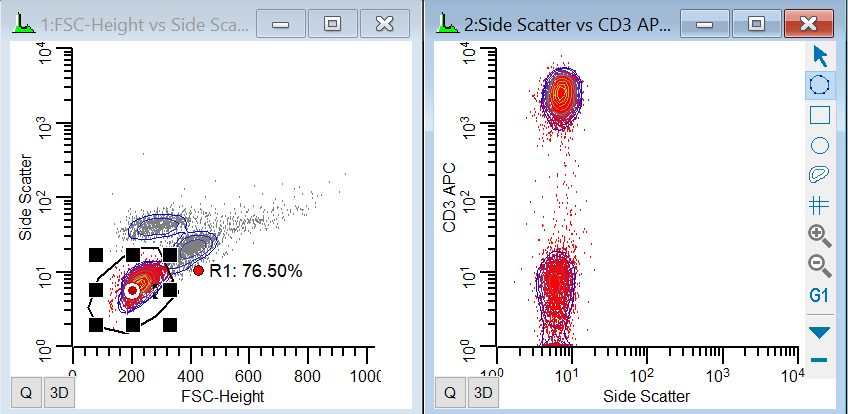
Did you know that you can apply a cascade gate to any histogram by clicking on the region's hotspot and then clicking on the title bar of the histogram you want to gate? You can also hold down the Shift key if you want to apply a cascade gate to several histograms at once.
7. Draw region R2 around the CD3-positive population in the new histogram. Click on the cascade hotspot for R2, move the mouse onto the data source window, and draw a third histogram.
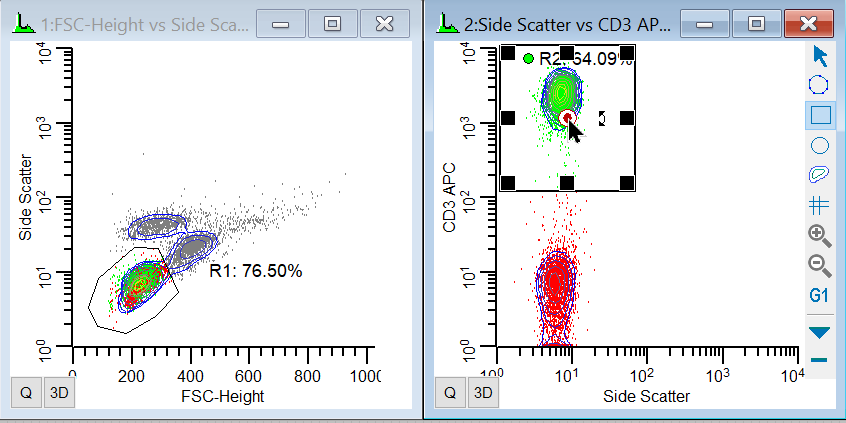
In the Edit Histogram dialog, select CD8 PerCP for the X Axis and CD4 PE for the Y axis, and then click OK.
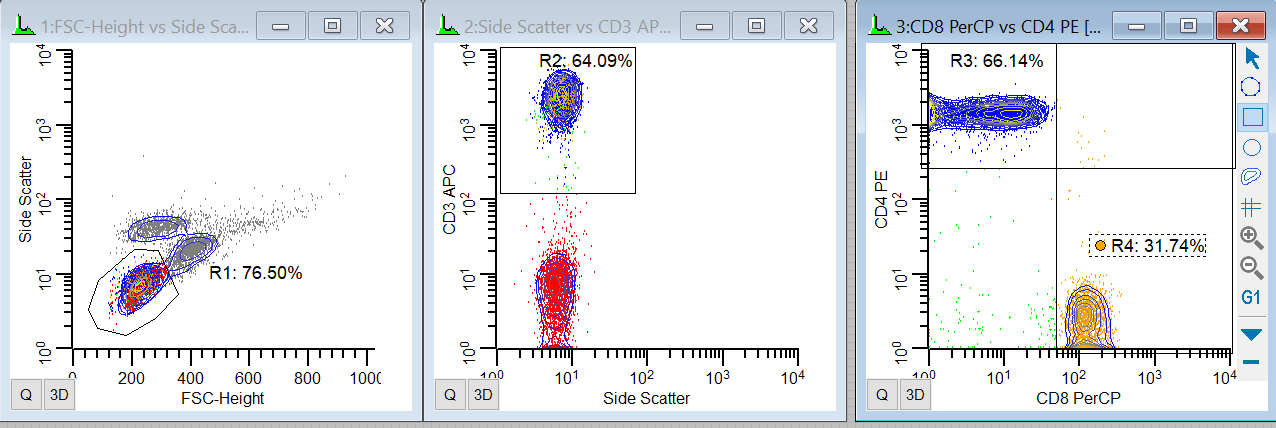
8. Finally, draw two more regions: R3 to define the CD4 positives and R4 to define the CD8 positives, as shown in the following picture. Note that we intentionally capture some events as CD4+CD8+ in this example.
You can choose a different region drawing tool from the histogram toolbar to draw regions of different shapes.
Creating the FCOM parameter
OK, now for the fun part. Let's create the FCOM parameter.
9. Click the Add Parameter button on the main ribbon bar. Alternatively, you can right-click in the data source and choose Add Parameter from the context menu.

10. Click the Add button in the Edit Calculated Parameters dialog to add a new parameter.
Let's choose an example equation from the Functions list box.
11. Select (FCOM(G1,G2,G3)+0.5)*1024/8+FRND(10) from the list of example equations.
We need to edit this example equation to use gates G2, G3, and G4.
12. Edit the equation so that it reads (FCOM(G2,G3,G4)+0.5)*1024/8+FRND(10). Type FCOM in the Name edit box.
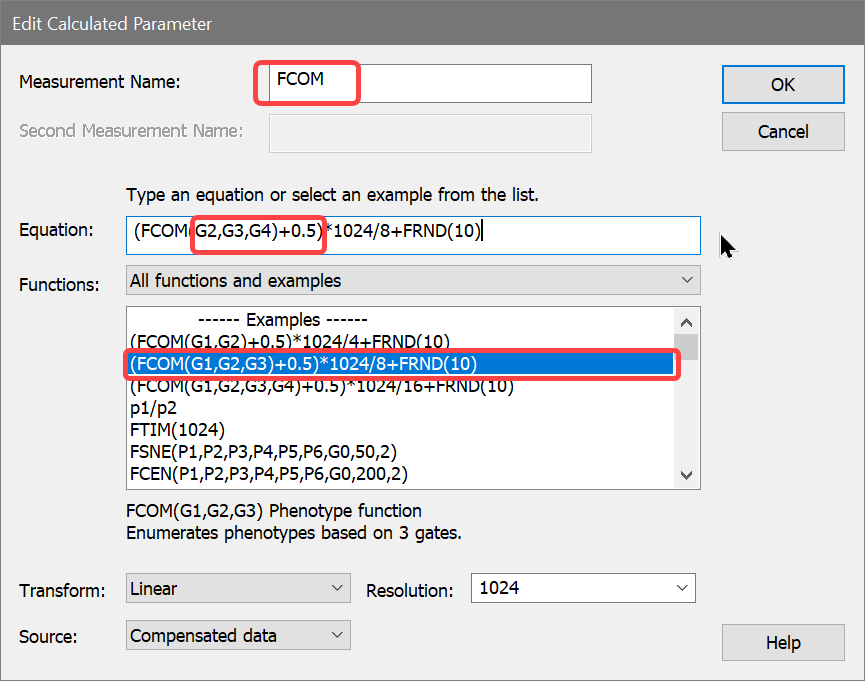
This equation looks more complicated than it really is. The FCOM function can have any number of gates as arguments. The way it works is described in the reference section of the manual. Here is how it works with our example. Using the 3 gates "G2, G3, G4" as the arguments for our FCOM, there are 8 possible classifications for each event in the listmode file. An event can be negative for all gates, positive for all gates, or some other combination. The table below shows the possible FCOM values for the G2, G3, and G4 gates.
G2 |
G3 |
G4 |
FCOM Value |
- |
- |
- |
0 |
+ |
- |
- |
1 |
- |
+ |
- |
2 |
+ |
+ |
- |
3 |
- |
- |
+ |
4 |
+ |
- |
+ |
5 |
- |
+ |
+ |
6 |
+ |
+ |
+ |
7 |
FCOM converts gate combinations to a single number identifying the phenotype. The more gates in the expression, the more possible combinations there are. The rest of the equation spreads the populations so that we can visualize them more easily on a histogram display.
13. Click OK to close the Edit Calculated Parameter dialog, and click OK again to close the Edit Calculated Parameters dialog.
WinList creates the new, calculated, listmode parameter that can be used like any other parameter in the listmode file. Let's create a histogram to see what it looks like graphically.
You can use FCOM parameters in 1P, 2P, and 3P histograms. You can plot it against another parameter in the listmode file to see the phenotype as a function of that parameter.
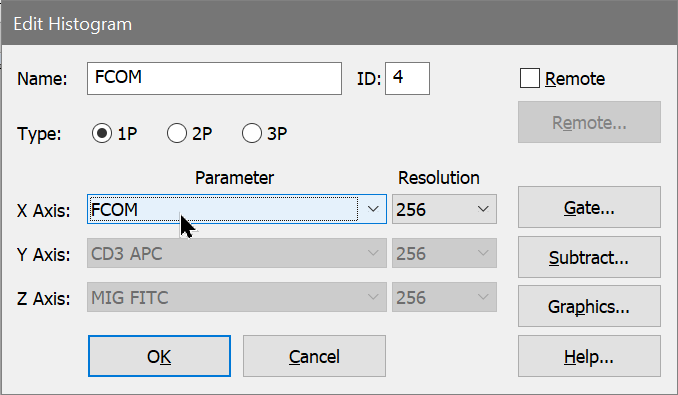
14. In an empty portion of the data source window, draw a new histogram with the mouse. We want to make this window wide, so hold down the Alt key as you draw the histogram. When you release the mouse, the Edit Histogram dialog is displayed. Choose 1P for the histogram type, and choose the last parameter in the list, FCOM, for the X Axis. Click OK.
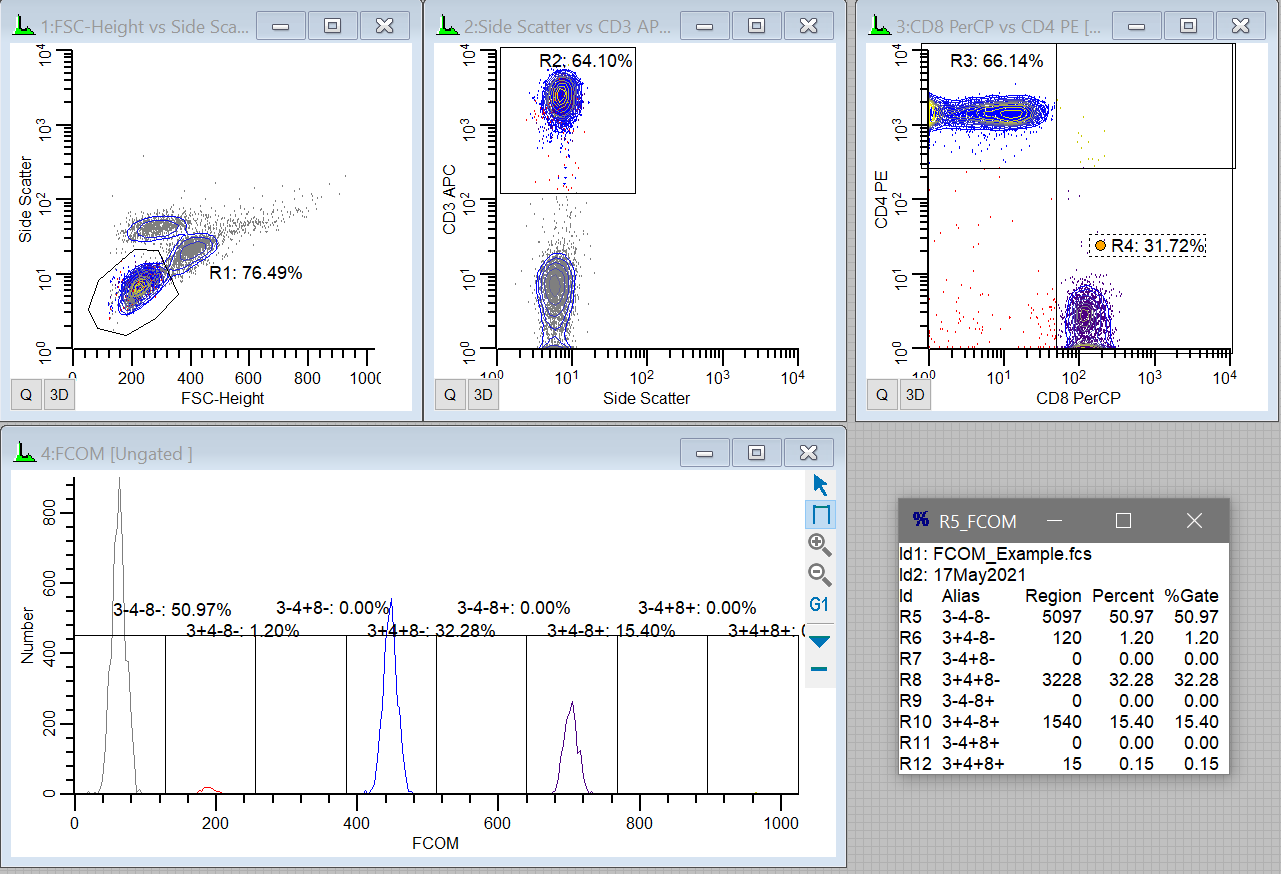
This new histogram has distinct peaks representing the eight possible states for events evaluated by gates G2, G3, and G4. The left-most peak represents events outside of all three gates, the triple-negative events. The next peak contains events that are in G2 but not in G3 or G4. The last peak represents triple-positive events in all gates.
Statistics
WinList makes it easy to get statistics for each phenotype and to see each distribution in the context of other histograms. To do this, we'll use the Create Region Array feature to create a set of regions and results.
16. From the Insert tab of the ribbon bar, click the Region Array button. Click the checkbox labeled Create a region array for the FCOM peaks. This is a special option that only appears when the active histogram contains an FCOM parameter.

The FCOM Region Array Options dialog appears. This dialog allows you to turn on color gating based on the FCOM peaks, and to choose the colors used for those gates. It also allows us to name the gates to make it easier to identify phenotypes.
17. Type 3 in the G2 alias edit box, 4 in the G3 alias edit box, and 8 in the G3 alias edit box.
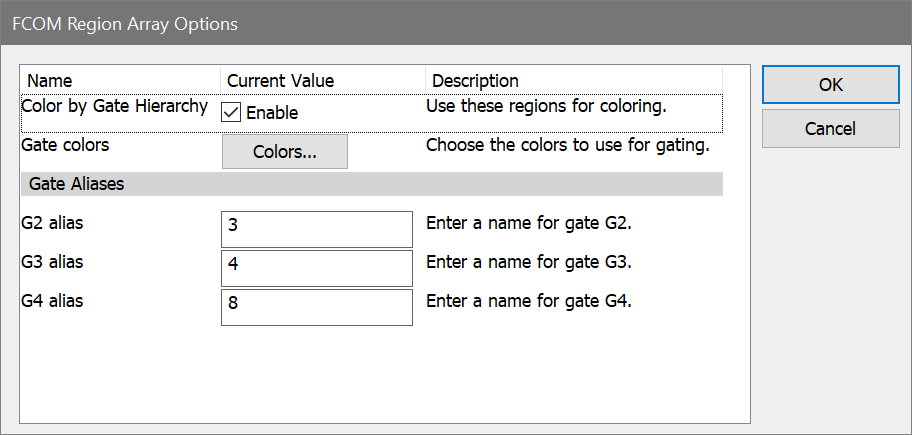
18. Click OK to close the dialog. Click OK again to close the Create Region Array dialog.
WinList creates 8 regions and positions them on the FCOM peaks. The regions are labeled to show the phenotypes. A result window shows the statistics for each peak, along with the phenotype labels. Each population is color-coded in the histogram to make it easy to identify the phenotype.
Extending this system
Since the FCOM parameter can take any number of gates, you could look at all the combinations of four gates (16 combinations) or more. You can create more than one FCOM parameter, each with the phenotype of a different set of gates, and then display a 2P histogram of the two FCOM parameters. You can even save the FCOM parameter into a new FCS file using the Save Data Source option in the File menu.
See Also: