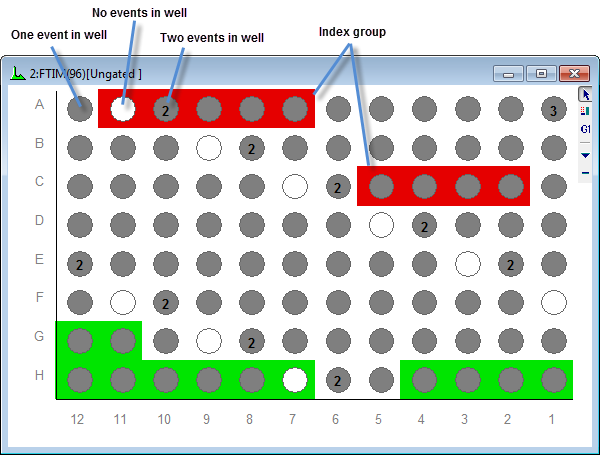
The Index Analysis window is a special display for parameters that contain index-like data. Some plate-sorting cytometers create index parameters that indicate which well on the sort plate each event went into. The Index Analysis window is a great tool for viewing and investigating that information.
An Index Analysis window can be created for any index-like parameter in the FCS file. There are controls for setting the number of rows and columns to display, as well as how to label the rows and columns. In some cases, the FCS file may contain keywords to help the Index Analysis window figure out how to display the rows and columns. See Edit Index Analysis for details.
You can create "groups" of related wells on an Index Analysis window, much like regions on a histogram except that groups can contain locations that are not next to one another. In fact, each group you create has an associated region so that you can display statistics for it in a Results window as you would with other regions. See Index Analysis Groups for information on creating and editing groups.
Index Analysis plots can display the color-event information from regions in other histograms. You can also choose to color events based on the groups in the Index Analysis window.