"Analysis Groups" in an Index Analysis window are the equivalent of "regions" in a histogram window. An analysis group identifies a set of wells in the Index Analysis window, and you can report statistics and perform event coloring with analysis groups just as you would with a region in a histogram.
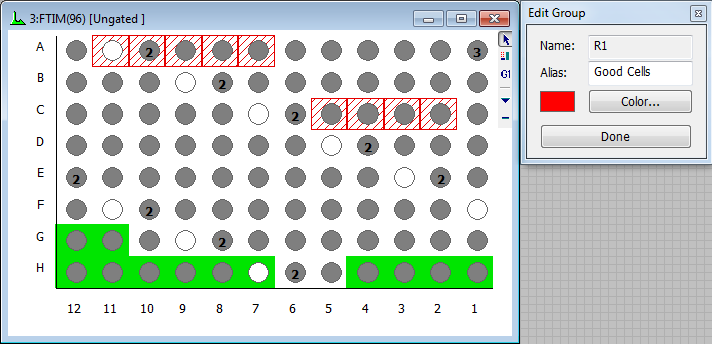
In the image below, there are 2 groups defined. The red-colored boxes represent group R1, which is named "Good Cells". This group contains 5 wells on row A and 4 more wells on row C. The green-colored boxes represent group R2, named "Bad Cells".
Creating a Group
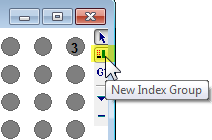
With an Index Analysis window created, use the Create Group tool in its toolbar to start a new group of wells.
This will display the Edit Group dialog, which identifies the results region associated with the group. You can type an alias and pick a color for the group you are creating in this dialog.
With the Edit Group dialog open, click and drag the mouse over the wells that you want to include in the group. If you want to add cells that are not next to one another, press and hold the Ctrl key on the keyboard before you click the mouse.
When you have finished with selection of wells, click the Done button to close the Edit Group dialog.
Editing a Group
Once a group has been created, you can edit the group by clicking on any one of its wells. This will display the Edit Group dialog. Just as with creating a group, you can select wells, change the alias and edit the color of the group. If you want to add cells that are not next to one another, press and hold the Ctrl key on the keyboard before you click the mouse.
When you have finished selecting wells, click the Done button to close the Edit Group dialog.
Deleting a Group
To delete a group, right-click the mouse on any well in the group and select Delete from the context menu.
Creating Results for a Group
To create results for a group, right-click the mouse on any well in the group and select Create Results in the context menu. The statistics that can be displayed are limited to frequency-based statistics; intensity and position statistics are not computed for Index Analysis groups.
Using a Group to Gate other Histograms
Sometimes it is useful to see where the wells in a group appear in other histograms. One method for doing this is to use the group to gate another histogram. Right-click on a group and select Cascade Gate from the context menu, and then click the title bar of the histogram you want to gate on the group. The histogram will show only those events that are in the wells selected in the group.