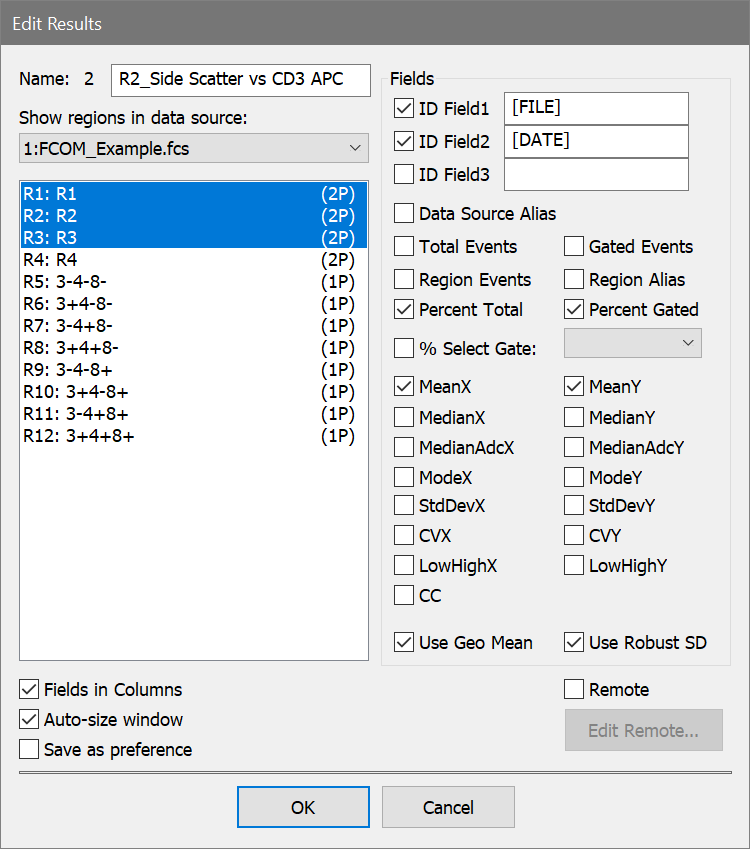
This dialog box appears when creating or editing a results window. It allows the user to choose what statistics will be displayed and for which regions. You can also establish remote links with other programs through this dialog box.
One of the important concepts relating to WinList's results has to do with the sampling of events involved with the calculations. Normally, WinList uses a sample of the data, called a packet, for performing calculations and displaying statistical and graphical information. The number of events in the sample packet is set in Edit Program Controls. As the packet size increases, so does the number of events evaluated by WinList.
If you want to see statistics for the entire data file, you need to use one of the options in the Replay menu to re-read the data, or click the Replay Data Source button on the Toolbar.
Name
The ID and name of the Results window are shown. An edit box displays an editable name up to 250 characters long. The name can include FCS Keywords, in which case WinList will extract the keyword values from the data file for display as the results window's name. See Appendix B: Internal Keywords for more information.
Show regions in data source:
This dropdown contains a list of all data source windows. Select a data source from the list to see the regions that have been created in that data source. Then select the regions you want to appear in this Results window.
You can select regions from any number of data sources to be included in the results window.
Region list
This list displays the regions that are created in the selected data source. Select the region you want to include in this results window.
Fields
ID Field 1 and 2
If ID Field1 or ID Field2 check boxes are checked, WinList displays the contents of the edit boxes next to these check boxes at the top of the results window. If the content of the edit box is braced by square brackets (e.g. [$SAMPLE]), WinList will search the keywords of the current file for a match. If it finds a matching keyword, the value of the keyword will be displayed within the results window. This option is handy to identify file-specific information about the current data source.
Data Source Alias
When this field is checked, the name of the data source window will appear to the left of each region in the result window. This is useful when one results window is used to display results from several data sources.
Total Events
This option displays the total number of events currently used by WinList. This number is normally Packet Size number of events or the number of events in the data file. In order for WinList to display and analyze the total number of events in the data file, replay the data using one of the options in the Replay menu whenever you want to update the statistics. For more information on Packet Size, see Edit Program Controls.
Gated Events
This option displays the number of events that passed through the gate assigned to the histogram containing the region. If there is no gate, this number will equal Total Events. See the discussion of Total Events above for the effect of Packet Size on the number of events considered.
Region Events
This option displays the number of events that fall within the region. See the discussion of Total Events above for the effect of Packet Size on the number of events considered.
Region Alias
This option displays the region's alias name for each region in the results window. Region alias names can be edited in the Region List dialog box.
Percent Total
This option displays the number of events within the region as a percentage of Total Events. See the discussion of Total Events above for the effect of Packet Size on the number of events considered.
Percent Gated
This option displays the number of events within the region as a percentage of Gated Events. See the discussion of Total Events above for the effect of Packet Size on the number of events considered.
% Select Gate
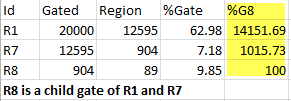
This option has two elements: a checkbox to enable or disable it, and a drop-down list of all active gates. Similar in concept to Percent Gated, this option allows you to choose any gate on which to compute percentages for the regions in the results window. Since this statistic can be selected for regions that do not have an obvious relationship to the selected gate, it is important to understand how this computation is performed.
If the region represents a child gate of the selected Gate in the gating hierarchy, the statistic is very simple. It is the number of events in the region, multiplied by 100 and divided by the number of events in the selected Gate. This is the typical case.
However, if the region is not a child gate of the selected gate, the statistic is a little more complicated. The numerator of this statistic is the number of events in the region. The denominator is the number of events in the selected Gate, which may not be the same as the number of events in the region associated with the selected Gate.
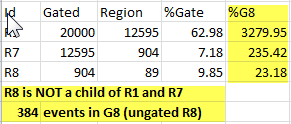
If the region whose results are being computed is contained in a data source that does not own the gate in % Select Gate, the statistic will show 0.00 regardless of the number of events in the region or in the gate.
Mean X and Mean Y
This option displays the X and Y arithmetic mean for the selected regions. The units reported are linearized units. The computation will be slightly different for log parameters when the Use Geometric Mean option is toggled on or off.
Median X and Median Y
This option displays the X and Y median for the selected regions. The units reported are linearized units.
Median ADC X and Median ADC Y
This option displays the X and Y median in ADC units.
Mode X and Mode Y
This option displays the X and Y mode for the selected regions. The units reported are linearized units.
StdDevX and StdDevY
This option displays the X and Y standard deviation for the selected regions. The units reported are linearized units.
CVX and CVY
This option displays the X and Y percent coefficient of variation (CV) for the selected regions.
LowHighX and LowHighY
This option displays the low and high X and Y values for the selected regions. The units reported are linearized units.
CC
This option displays the correlation coefficient for the selected regions.
Use Geometric Mean
If a parameter is displayed on a log scale, this option controls whether the mean value is an arithmetic or geometric mean. A geometric mean calculates the arithmetic mean of the log data, and then linearizes the result. With the option unchecked, the mean is computed on linearized data.
Use Robust SD
The Robust SD is a variation on the SD calculation that is less influenced by outlier events. When enabled, the SD and CV computations use the Interquartile Range method for the computation. This is equivalent to BD Biosciences' rSD and %rCV computation.
Other options
Fields in Columns
When checked, the results window will display statistics, or fields, in columns. Each row will represent a different region. If unchecked, regions are in columns, and a different statistic appears in each row.
Auto Sizing
If this option is checked, WinList will automatically calculate the size that the results window needs to be in order to display the selected statistics and re-size the window as necessary. If the option is not checked, WinList will not adjust the results window's size.
Save Preference
Click this button to keep the current settings as default settings for all results windows.
Remote checkbox
This check box, in conjunction with the Edit Remote button, allows WinList to establish a Dynamic Data Exchange (DDE) link with another Windows application. If checked, the Edit Remote button is enabled.
Edit Remote
Click this button to establish a remote link with another application, or to edit the script used for that connection. See Edit Remote for more details on Remote links and DDE.
OK
Click this button to accept all changes and close the dialog box.
Cancel
Click this button to exit the dialog box with no changes.