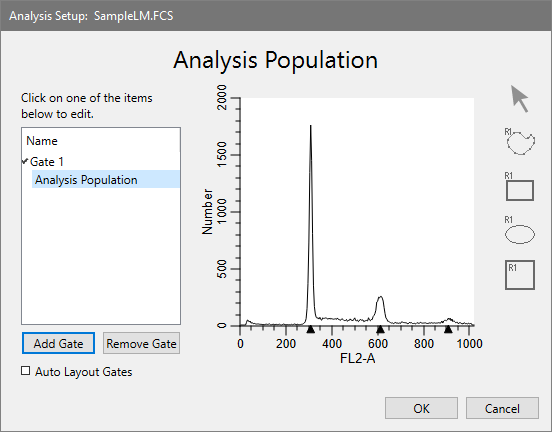

When you open an FCS listmode file, ModFit LT will present a dialog that allows you to choose which parameter you want to analyze and parameters to use for gating.

The dialog contains a tree on the left side showing available gates and the analysis population. A graphical view of the selected item is shown on the right side of the dialog.
Analysis Population
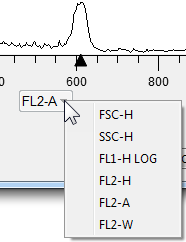
Choose the parameter you want to analyze by clicking the label on the X axis and selecting a parameter from the list.

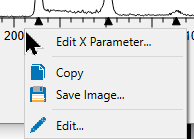
You can right-click the X-axis and choose Edit X Parameter to change the transformation used for the parameter. See Edit Properties for Parameter for additional info.

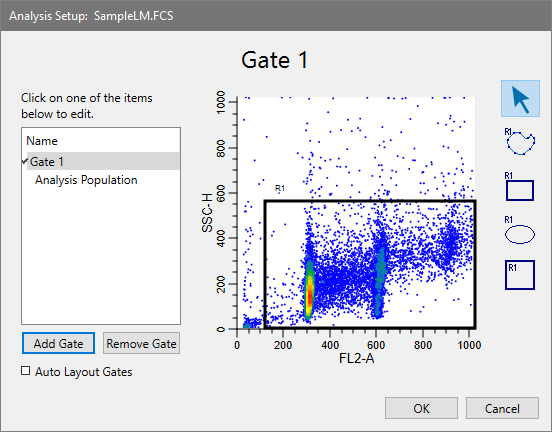
Gates
After you choose the Analysis parameter, you can create gates. Use the Add Gate button to create a new gate, and the Remove Gate button to remove an unneeded gate. Gates are logical "AND" gates, which means that events must satisfy all active gates to display in the analysis histogram.
Select a gate item in the tree to display the gate in the right-hand panel of the dialog. With the item selected, click the X- and Y-axis labels to pick the gating parameters for the plot. Use the region tools on the right to define a gating region on the plot.

Graphics for the gating plot can be edited by right-clicking the plot area and selecting Edit Properties. See Edit 1P Graphics and Edit 2P Graphics for additional details.
Define each gate for your analysis. The active gates will appear on the report page and can be modified there once created.
The Auto Layout Gates option can be enabled to automatically organize gates on the report. Uncheck this option if you create your own arrangement for gates.
Click OK to finish the gate and analysis population selection.