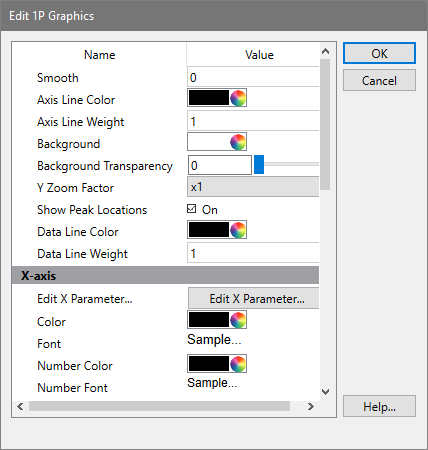
This dialog is used to change the graphic properties for 1P histograms.

Smooth
This value determines the amount of smoothing for the histogram. Set to 0 for no smoothing.
Axis Line Color
Choose the color of the axis line.
Axis Line Weight
Choose the weight of the axis line.
Background
Choose the color of the background page.
Background Transparency
Sets the transparency of the background.
Y Zoom Factor
Select a zoom factor for the Y direction.
Show Peak Locations
Enable this option to see where ModFit found peaks in the file. The peaks are shown as triangles on the axis.
Data Line Color
Choose the color of the data line.
Data Line Weight
Choose the weight of the data line.
X-axis and Y-axis properties
Edit X (or Y) Parameter
Displays a dialog to Edit Properties for Parameter, to edit transformations, the name, etc.
Color
Choose a color of the axis label.
Font
Select the font of the axis label.
Number Color
Choose the color of the axis tic numbers.
Number Font
Select the font of the axis tic numbers.
Auto Minimum
Enable this option to automatically set the minimum of the axis.
Minimum Value
When Auto Minimum is not enabled, this value sets the minimum value displayed by the axis.
Auto Maximum
Enable this option to automatically set the maximum of the axis.
Maximum Value
When Auto Maximum is not enabled, this value sets the maximum value displayed by the axis.
Auto Calculate Major Tics
Enable this option to automatically determine the major tic unit for the axis
Number of Major Tics
When Auto Calculate is not enabled, this value sets the major tic unit of the axis.
Auto Calculate Minor Tics
Enable this option to automatically determine the minor tic unit for the axis.
Number of Minor Tics
When Auto Calculate is not enabled, this value sets the number of minor tics per major tic on the axis.
Actions
OK
Click this button to accept the changes and close the dialog box.
Cancel
Click this button to discard any changes and close the dialog box.