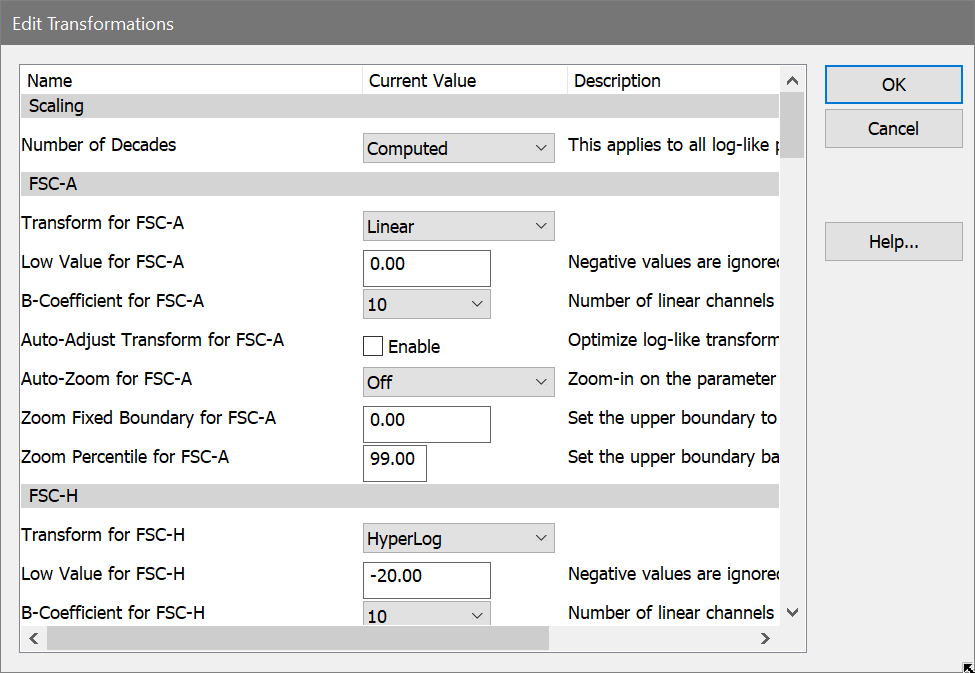
This dialog allows you to select linear parameters to convert from linear to log and log-like transforms.
Most flow cytometers store data in linear format, even if you view the data on log-like scale during acquisition and analysis. This dialog allows you to convert linear parameters to log-like for display and analysis in WinList.
Scaling
Number of Decades
This option determines how many log decades WinList will transform the linear data values into.
Choose Computed to allow the program to determine automatically the number of decades. With this option selected, the program computes the number of decades by taking the log of the ADC resolution of the parameter. For example, if the ADC resolution is 262144, the log10(262144) is approximately 5.42 decades.
Choose 4-decades to force the program to map the linear data into 4-decades. This option allows comparisons with other software that only permits 4-decade displays. In the example above, compressing 262144 channels into 4-decades of log space compresses the data by 1.42 decades.
Measurements
For each measurement in the file, you can set several properties. Transform settings apply to all histograms showing the selected measurement.
Transform
The transform can be set to Linear, Log, HyperLog, Hyperbolic sine, or VLog.
Low Value
This is the lowest value shown on the axis.
B-Coefficient
This value controls the linear portion of a HyperLog axis. The selected value is the number of channels on both sides of 0 that will be displayed as linear. The remaining portions of the HyperLog axis are display log-like.
Auto-Adjust
Enable this option if you want WinList to automatically adjust the B-Coefficient and Max Negative value for this parameter. Each time a new file is opened, WinList will readjust B and Max Negative settings.
Auto-Zoom
Auto-zoom allows you to eliminate unnecessary channels at the upper end of a parameter's dynamic range automatically. It is very useful for parameters like "Time" which only use a portion of the range, and for some instruments which store data in the lower portion of the range. Auto-zoom is set up independently for each parameter.
Off: Turns off auto-zoom for the parameter.
To highest used channel: Choose this option if you want WinList to eliminate empty channels on the upper end of the parameter. It is useful, for example, for a TIME parameter that typically only uses a small portion of the dynamic range of the parameter.
To fixed upper boundary: This option allows you to zoom to a specific channel for the upper boundary of the data. Use the associated Zoom Fixed Boundary edit box to set the channel for zooming.
To percentile: This option allows you to zoom in on a specified percentile. If, for example, 99% of your data is in the lower half of the dynamic range, it may be useful to ignore the remaining 1% of the data so that you can better visualize and analyze the 99%. Use the associated Zoom Percentile edit box to set the percentile for zooming.
Save preferences
When this option is enabled, the changes you make to the Transformations dialog are remembered.
See also:
Understanding Hi-res Data Files