
You can probably think of cases where you wanted to have a set of regions sharing common vertices so that they fit perfectly together. It is difficult to create regions that do that, especially if you also want to be able to make adjustments. WinList simplifies this task with its ability to create "sticky regions" quickly and easily. It allows you to stick regions together, and just as easily to unstick them.
Similarly, there are times when you want a region to adjust its size and shape based on the data beneath it. For example, as you read a new file into an analysis setup, it would be really helpful if the lymphocyte gate would auto-adjust to the new distribution. The "magic contour" region in WinList does exactly this.
This short tutorial will introduce these new region capabilities so that you can add them into your own analysis protocols.
If you are unfamiliar with opening files and creating histograms with WinList, you might want to do the WinList Basics tutorial before continuing with this one.
Open the FCS file
1. Click the Open FCS File button on the ribbon bar.
2. In the File Open dialog, navigate to the Samples folder located in the folder where WinList is installed. Select the BCell_BM_Tube_001.fcs and click Open.
3. In the Create Histograms dialog, add FSC-A vs SSC-A and CD38 vs CD10 histograms and click OK.
Create a contour region
4. Click the title bar of the FSC vs SSC plot to activate it, the click the Contour region tool in the histogram toolbar.
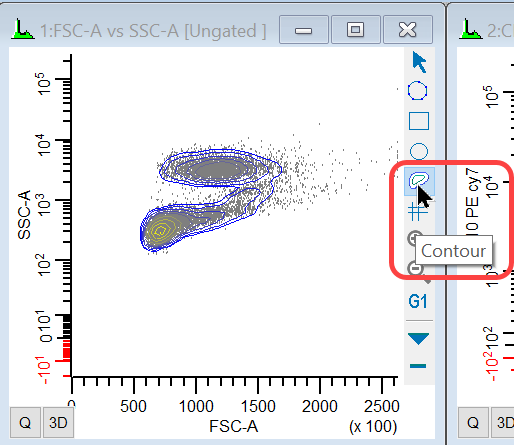
5. Click and drag to draw a box around the low SSC-A events. When you release the mouse, a contour region will be created from the data within the box you drew.
If you move the region (by dragging the label), the contour region will recompute on the data in the new location. Sometimes the resulting contour does not change because the bounding box contains the same probability distribution. For example, in the illustration above, moving one of the left handles to the left would not change the contour.
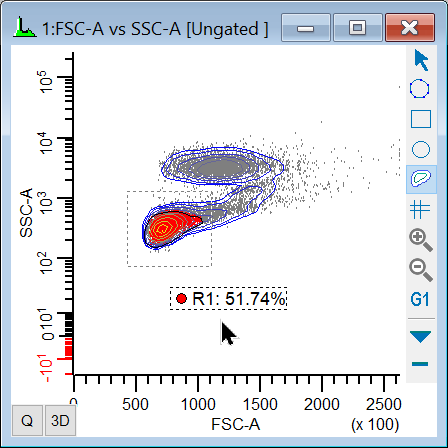
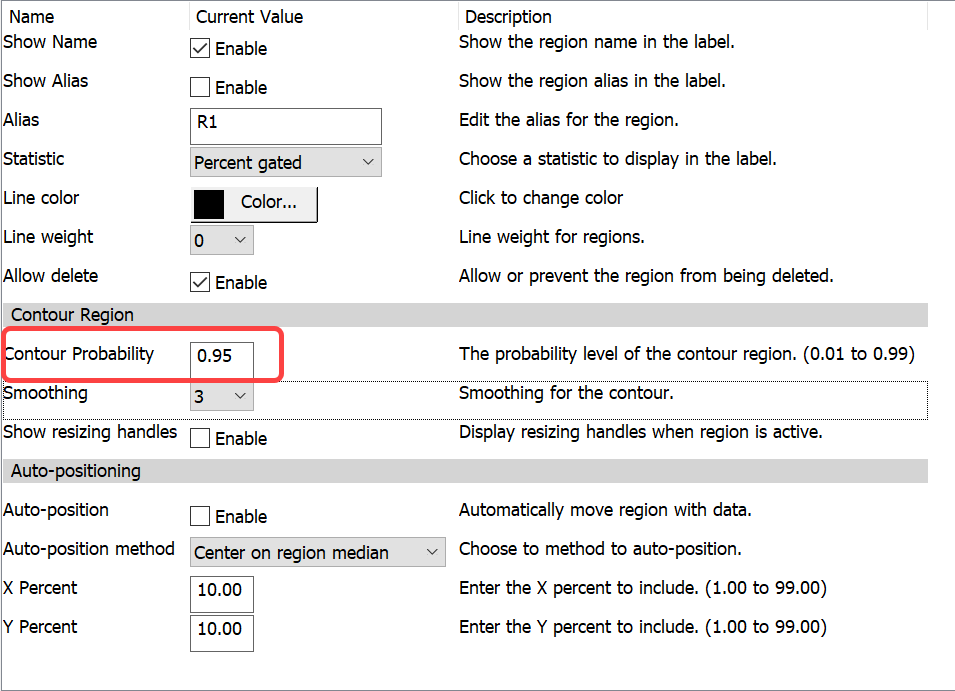
6. Right-click the region label and choose Edit Properties. The properties that relate to the contour region are grouped together. Edit the Contour Probability to be 0.95 and click OK.
The contour on the histogram will get a little bigger as a result of the edit, encompassing 95% of the events inside the contour region's bounding box.
Create sticky regions
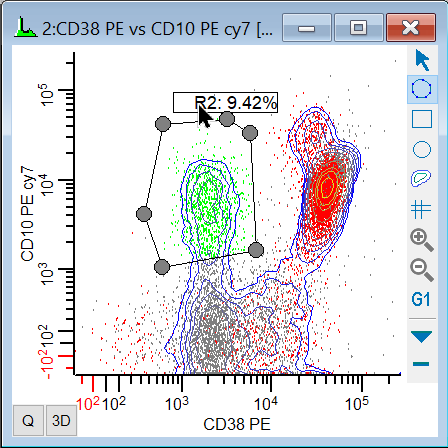
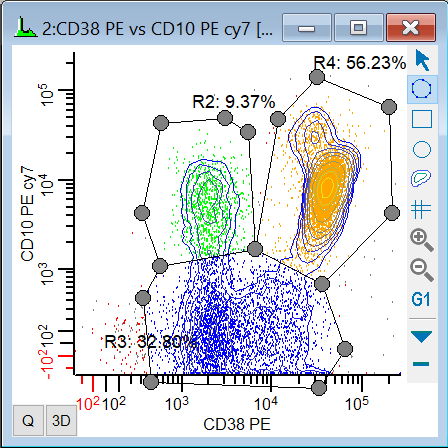
4. Click the title bar of the CD38 vs CD10 plot to activate it, the click the Freehand region tool in the histogram toolbar.
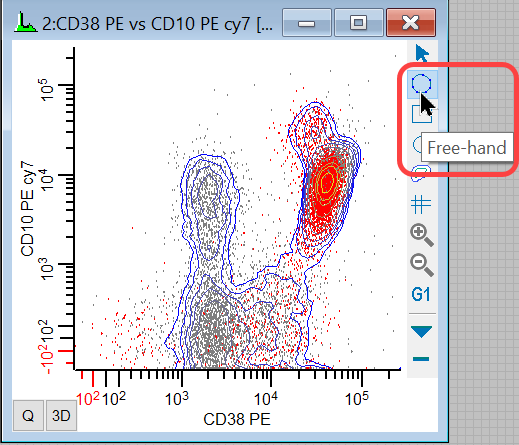
Let's create 3 adjacent regions in this plot using the point and click technique.
5. Click and hold the mouse for a second next to the CD10+ CD38- population, then release the mouse button. Move and click the mouse to define 6 or 7 points to surround the population, clicking back on the first point to close region R2.
6. Right click the region label and choose Show Vertices.
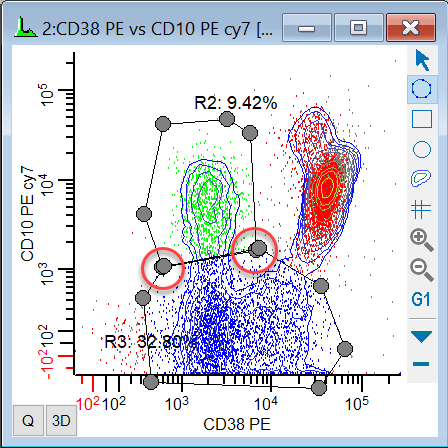
7. Click and hold the mouse for a second next to the CD10- CD38 dim population, then release the mouse button. Move and click the mouse to define points in the region, and make sure to click on top of the vertices at the bottom of R2. Click on the first point of R3 to finish the region.
8. Right click the region label and choose Show Vertices.
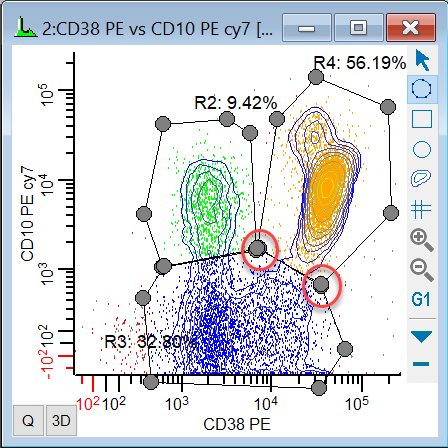
9. Click and hold the mouse for a second next to the CD101 CD38+ population, then release the mouse button. Move and click the mouse to define points in the region, and make sure to click on top of the vertices at the top of R3. Click on the first point of R4 to finish the region.
10. Right click the region label and choose Show Vertices.
So at this point, we have a set of adjacent regions that are completely independent of one another. If you move a region or common vertex, the other regions will be unaffected. We're about to change that.
Make it "sticky"
11. Right click the R2 region label and choose Stick to Neighbor Regions.
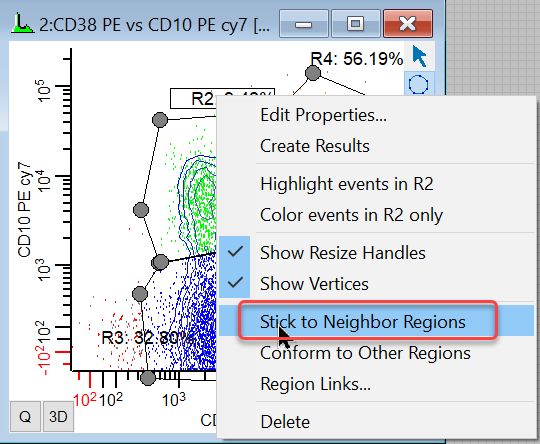
A toast message will display indicating that 3 connections were made.
12. Repeat this for regions R3 and R4.
Now your regions are dependent on one another. The common vertices are truly common: when you move a common vertex, all regions that share the vertex will be affected. Try it out.
If you move one of these regions (by the region label), the regions sharing vertices will be pulled to stay connected. You can also move individual vertices, and the connected vertices will move with them. This is a great tool for making sure that you single-count events and maintain adjacency even as you make adjustments to the regions.
Summary
This tutorial introduced the contour region and sticky regions. Contour regions are dynamic: they recompute the region whenever the data beneath them changes. They are a perfect tool for parts of your analysis where you want to reduce subjectivity in region placement and size, because they are computed based on probability.
Sticky regions make it possible to create a set of adjacent regions that maintain adjacency even if you move one region, or a vertex of a region.