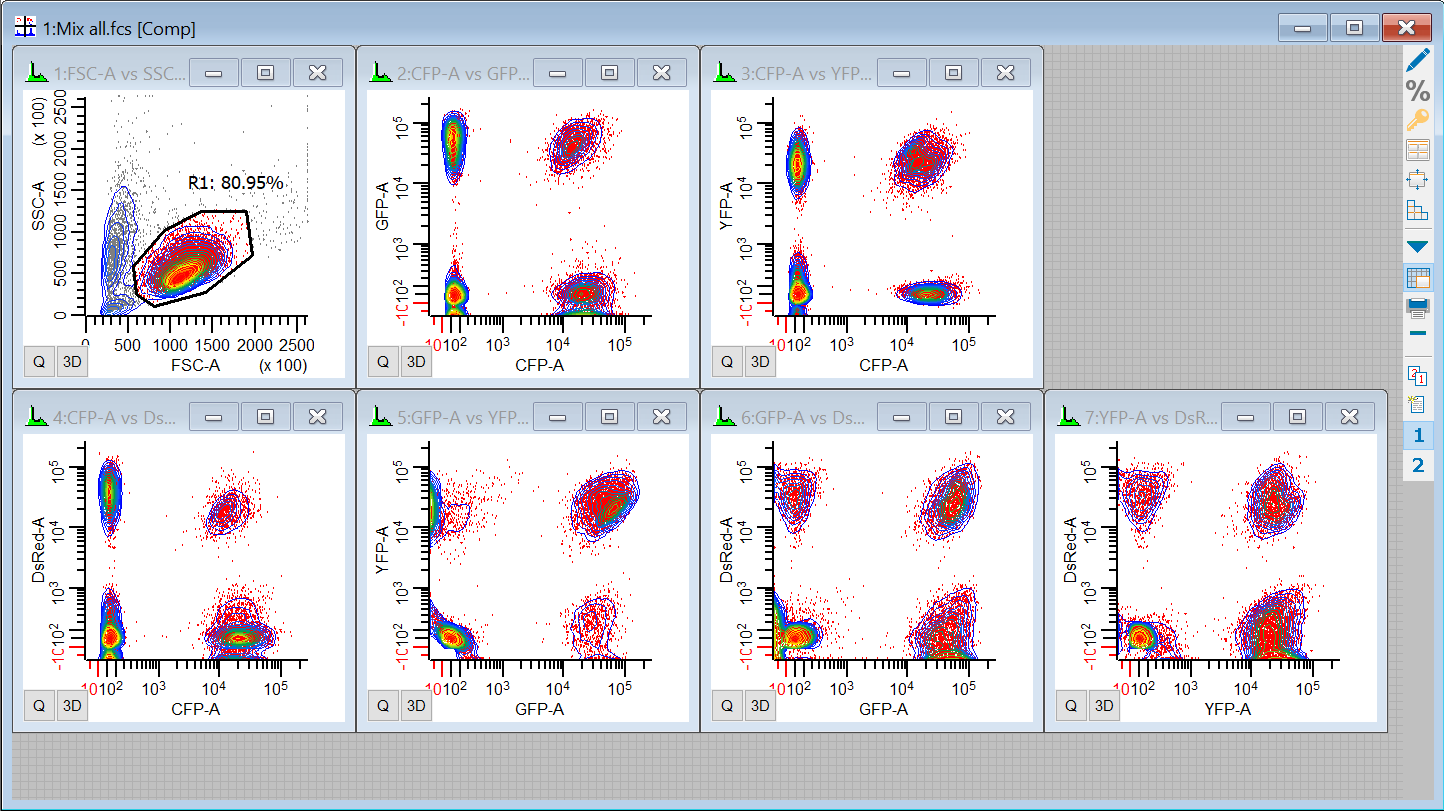
Cytometry assays continue to use more colors, providing a richer platform for understanding cells and biology. At the same time, as the number of colors increases, so does the complexity of properly compensating for fluorescence crossover. Let's explore a method for evaluating just how good your compensation setup is, confirming the strengths and revealing the weaknesses in a way the makes sense.
Compensation Review Mode in WinList is a visual tool that makes this possible. The process is simple: review each single-color control file, one by one, and examine how well the crossover values match the data. Compensation Review Mode performs some optimizations to make this process possible.
To use this mode you need a set of single-color control files that were used to set up the compensation. You may also want to review one or more all-color files.
Here's how it works. We'll use the compensation that we set up in Using Interactive N-Color Compensation as a test case, so make sure you do that tutorial first.
Open an all-color file
We start by opening an all-color file and applying the compensation that we want to review. That compensation might be loaded automatically by WinList by reading keywords from the file, or it may be compensation that you have set up in WinList.
1. Click the Open Protocol button and select "CompensationTutorial" - the protocol that was saved in the Using Interactive N-Color Compensation tutorial. There should be a FSC vs SSC plot, and 6 other plots for the fluorochromes.

Turn on Compensation Review Mode
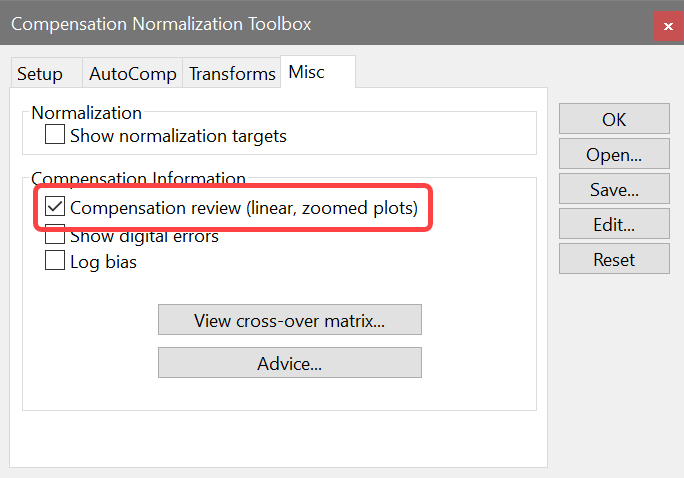
2. In the Compensation Toolbox, click the Misc tab and enabled Compensation review.
The display will change dramatically.
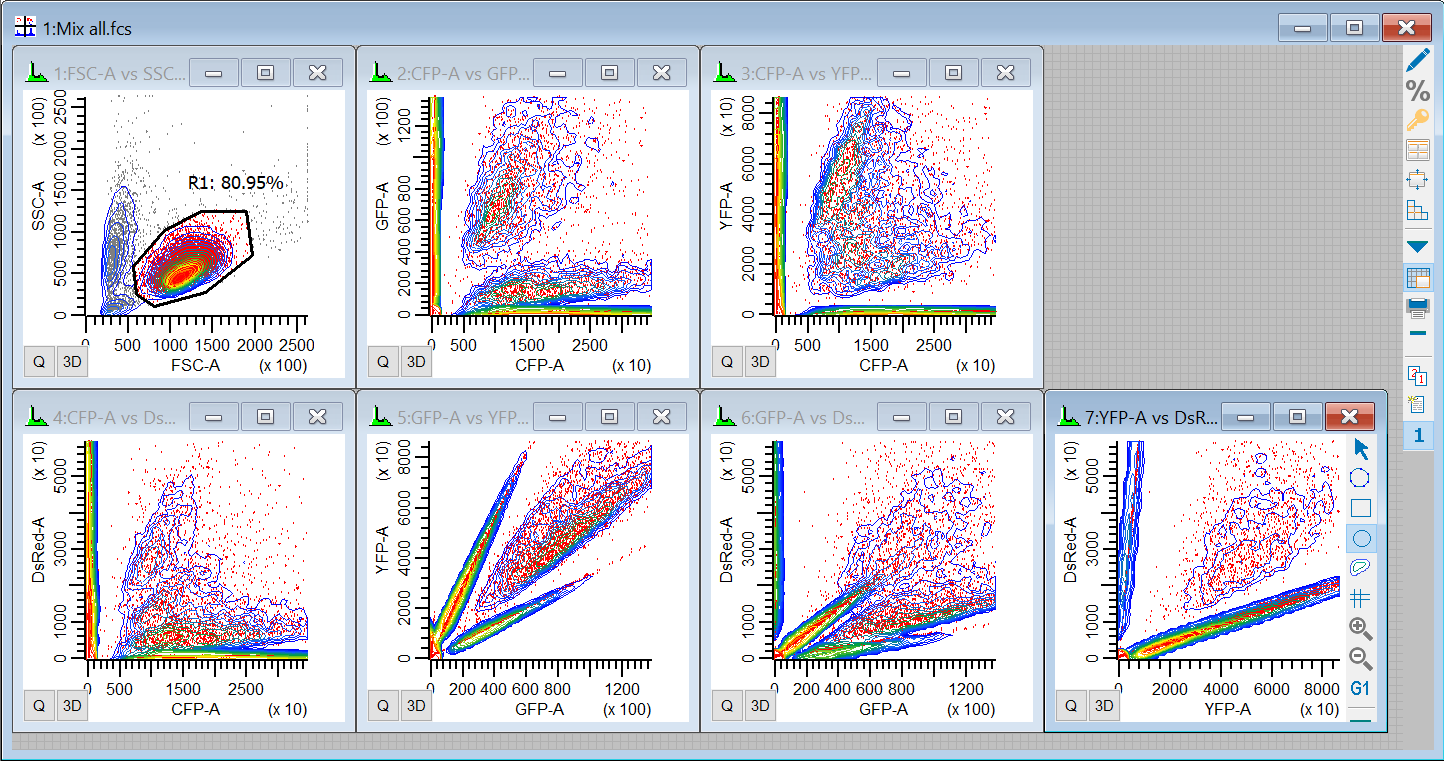
All of the plots that are normally showing a log-like axis will switch to a linear axis. Compensation has been temporarily disabled. In addition, the plots will "zoom" to the 95th-percentile. How is this going to help us review compensation? Let's keep going and find out.
Review the first control file
3. Click the Next Batch button on the batch toolbar to read in the first single-color control file that we used to set up the compensation.

4. On the Setup tab in the Show plots for list, select CFP-A, since this is the CFP-only control file. This will select the Compensation page, and you should see something like this:
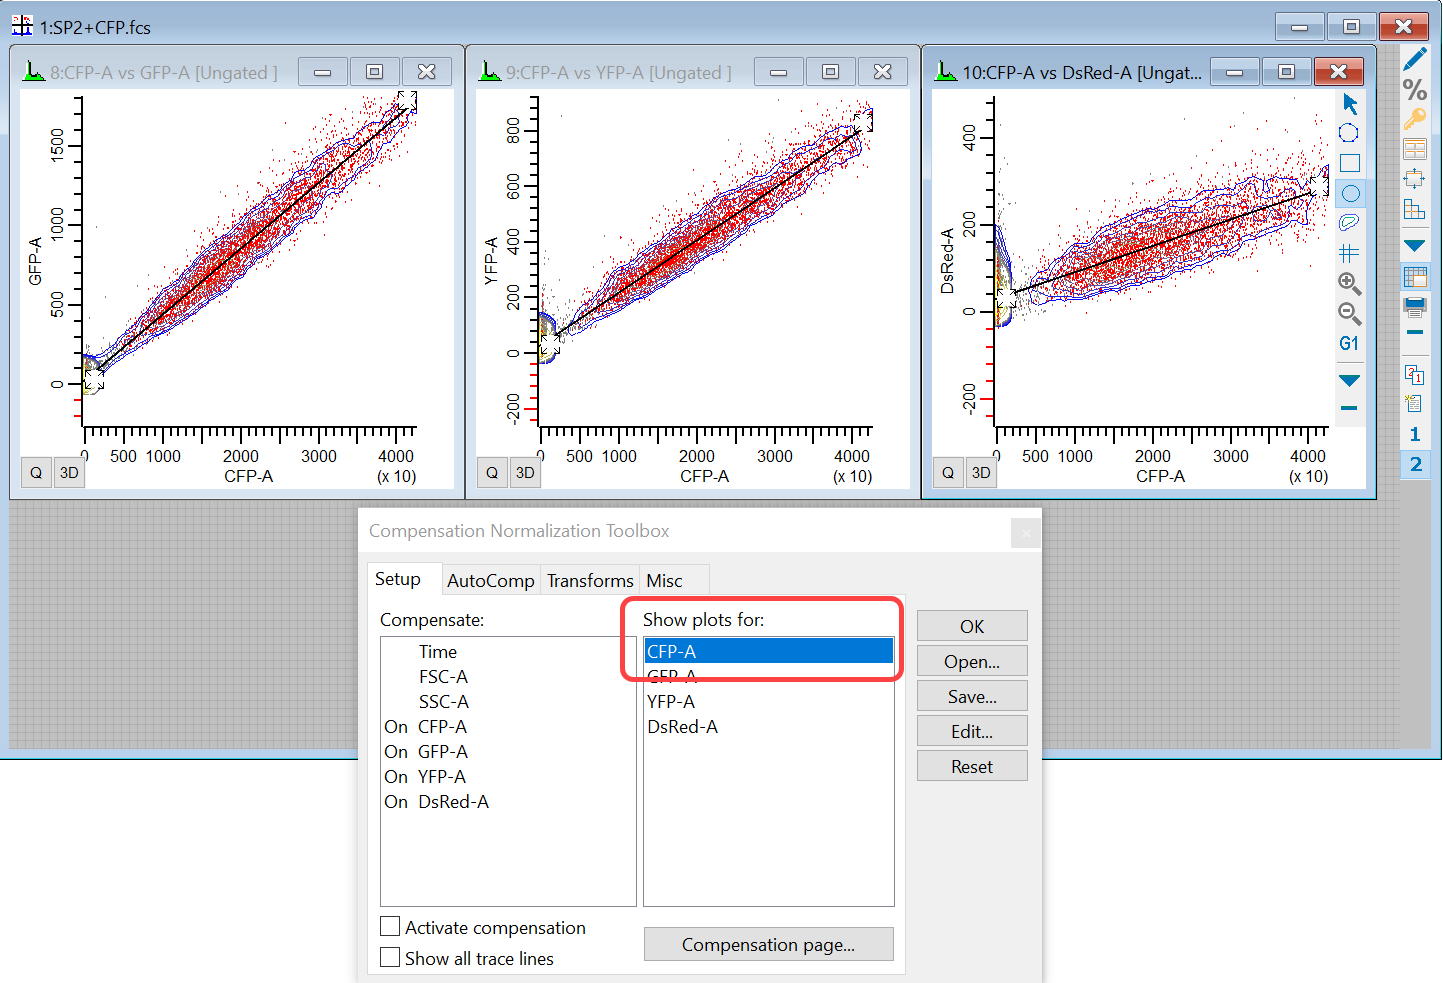
Only 3 plots are shown: the ones that involve CFP-A. The X-axis for each plot is CFP-A, and the Y-axis shows one of the other fluorochromes. The view is zoomed in on the 95th-percentile, and we're looking at linear plots so there are no warping effects from log transformations.
Most importantly, note the position of the trace lines in the plots. If the compensation is set up properly, the trace lines will pass right through the center line of the data. That appears to be the case here, so it looks like the CFP-A compensation is set correctly for the CFP control.
Let's check the other 3 controls in the same manner.
Review the other controls
5. Click the Next Batch button on the batch toolbar to read in the next single-color control file.

6. In the Show plots for list, select DsRed-A, since this is the DsRes-only control file.
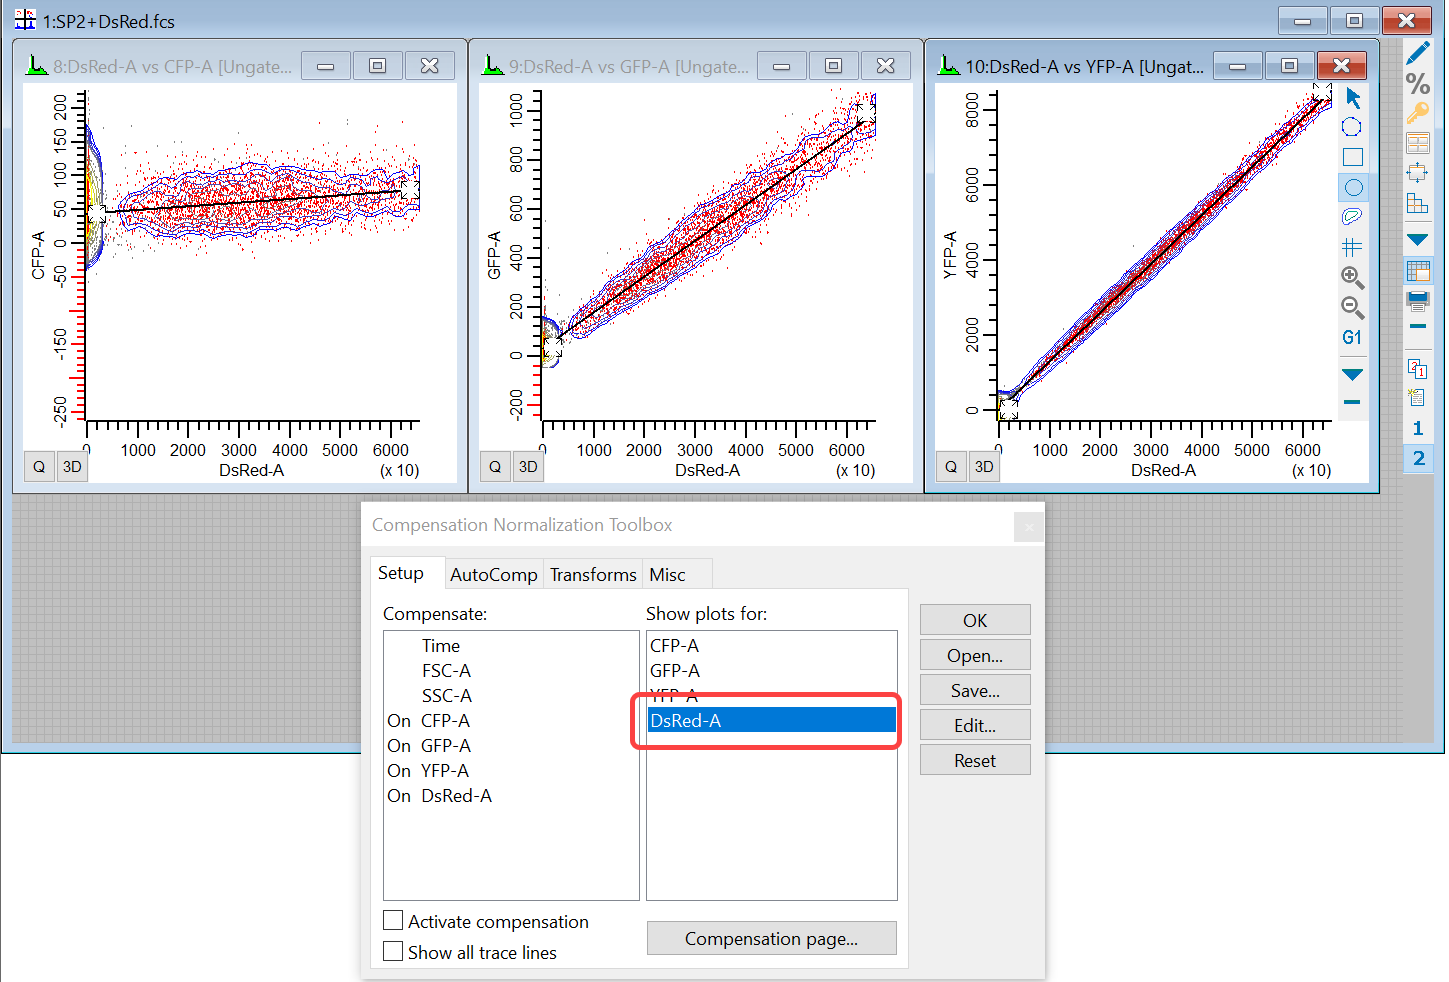
Now we see DsRed-A on the X-axis plotted against each of the other markers. The trace lines appear to pass through the center of the linear-displayed clusters, so the DsRed looks correct.
7. Click the Next Batch button on the batch toolbar to read in the next single-color control file.

8. In the Show options for list, select GFP-A for the GFP-only control file.
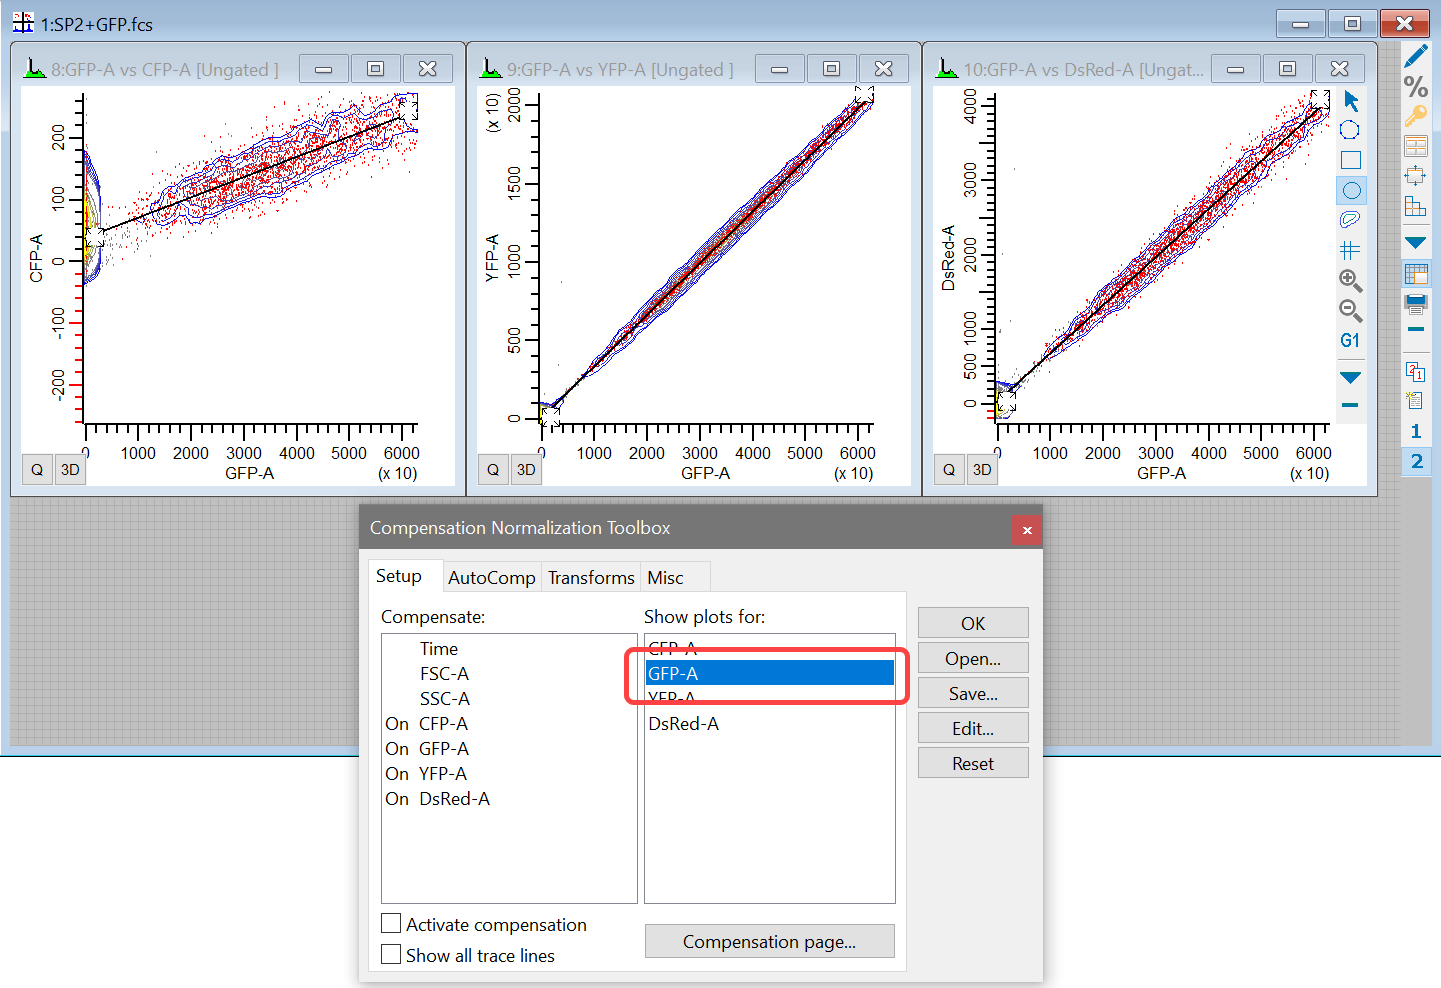
GFP also looks correct. We've got one more to review.
9. Click the Next Batch button on the batch toolbar to read in the last single-color control file.

10. In the Show plots for list, select YFP-A for the YFP-only control file.
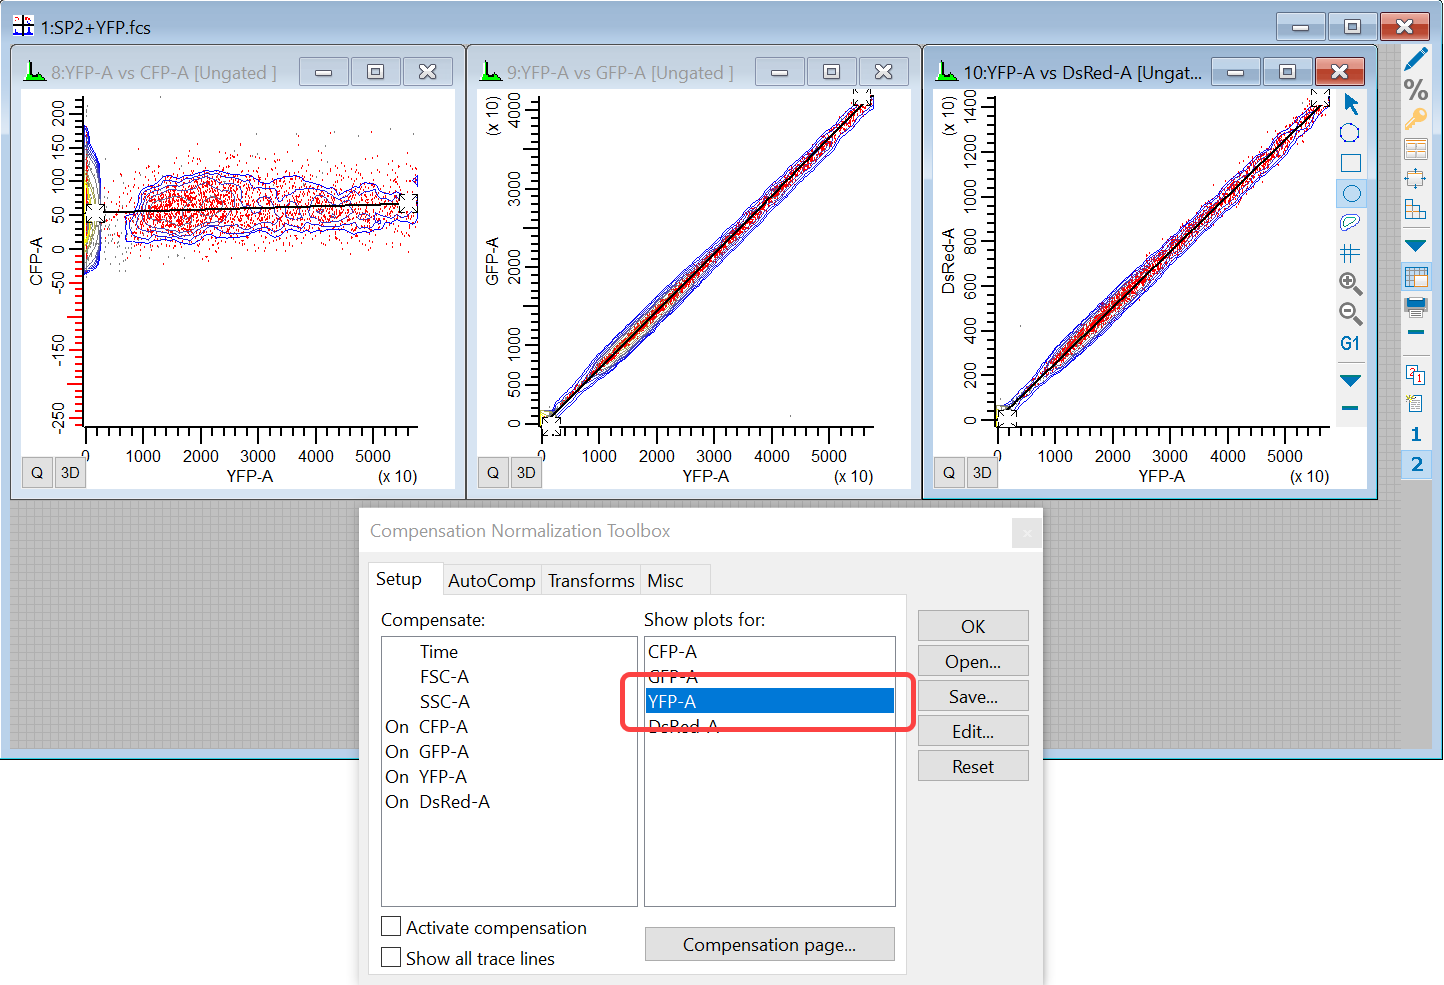
Once again, the trace line passes smack through the center of the distributions.
Interpretation
In Compensation Review mode, you are looking to see that the trace lines for each single-color control pass through the center (median) of the zoomed, linear distribution. That's one of the things Compensation Review mode does automatically for us. It's easier to see this when looking at linear axes with any high-end outliers clipped out. To demonstrate that point, here's the YPF control unzoomed and with Hyberboline Sine axes:
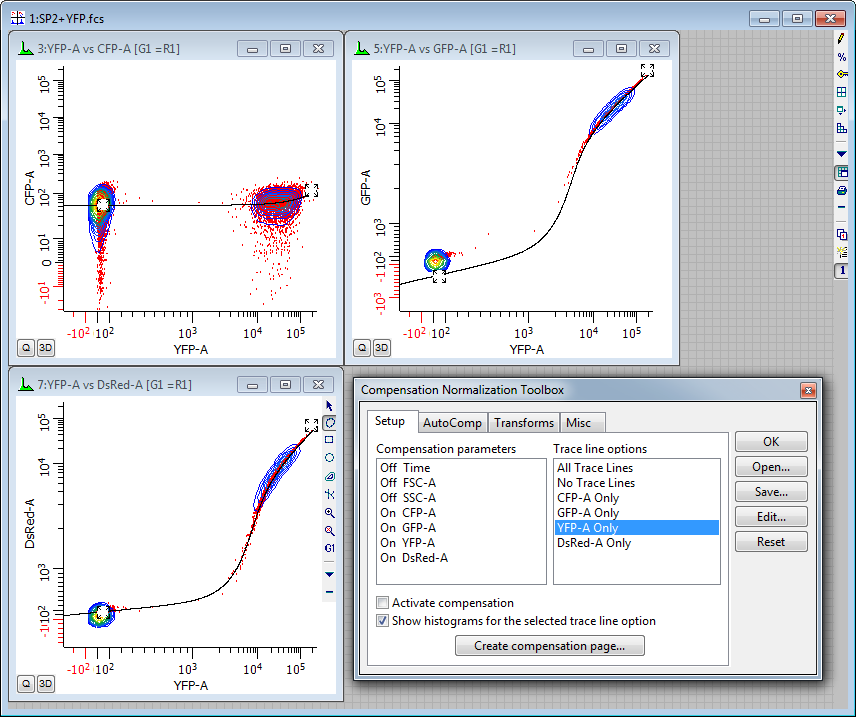
With this display, it is difficult to see what was quite simple and obvious in the zoomed, linear display.
You can also review the all-color file in Compensation Review mode. To do so, you open the all-color file and then use Show plots for to show each of the markers in turn.
11. When you finish with compensation review, uncheck the Compensation review option on the Misc tab of the Compensation Toolbox. Then switch back to page one of the data source to see all plots once again.
Summary
Compensation Review mode is a tool that simplifies the process of assessing fluorescence compensation. By switching transformations to linear and zooming in on the data, it becomes a simple task to determine whether a trace line passes through the center of a distribution. It is best used with single-color controls, but can also be used to review compensation on an all-color file.