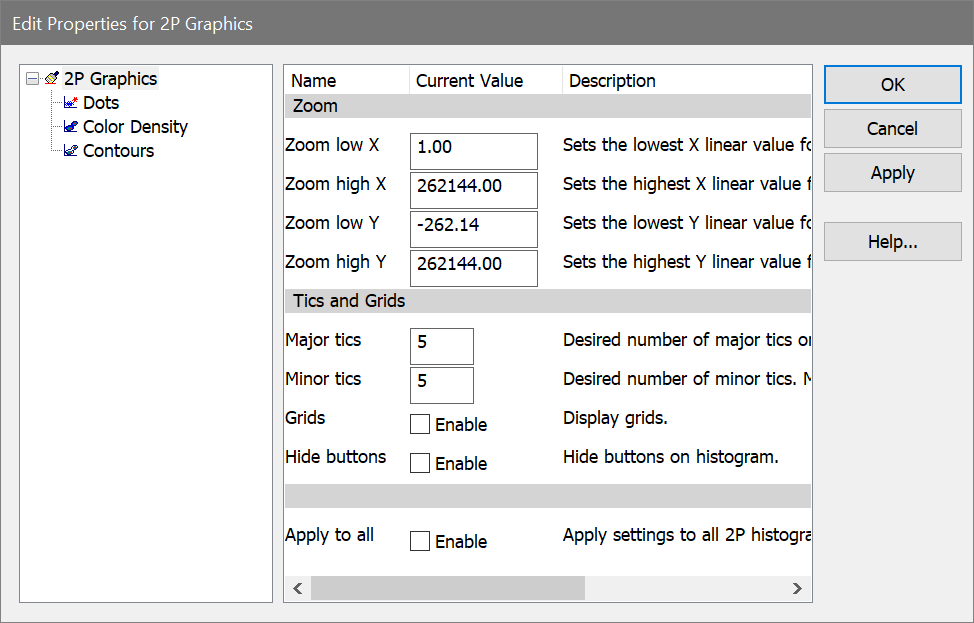
This dialog allows you to change the graphical display of a 2P histogram. It is divided into 4 sections in the tree on the left of the dialog: 2P Graphics, Dots, Density, and Contours.
2P Graphics
Zoom
Zoom low X
This value defines the lowest X parameter value that is shown in the histogram. Values that are below this are ignored.
Zoom high X
This value defines the highest X value shown in the histogram. Values above this are ignored.
Zoom low Y
This value defines the lowest Y parameter value that is shown in the histogram. Values that are below this are ignored.
Zoom high Y
This value defines the highest Y value shown in the histogram. Values above this are ignored.
Tics and Grids
Major Tics
Enter an approximate number of major tics you want to appear on the axes. Major tics are always divisible by 10, so the actual number of major tics may not be equal to the value entered here.
Minor Tics
Enter the approximate number of minor tics you want to display. The actual number displayed will be 2, 5, 10 or a multiple of 10.
Grids
This check box allows you to turn on or off the display of grids that appear on the major tic intervals. If the box is checked, grids will be displayed.
Hide button
Check this option to hide the "I" or "Q" button. QuadStat buttons are typically displayed on 2P histograms. Info buttons appear in histograms that have remote links or histogram subtraction results.
Apply to all
When this option is enabled, the settings for the selected histogram will be applied to all other 2P histograms when the OK button is clicked.
Dots
Enable this option to display dot density display.
This option will uncheck automatically if Color Density is enabled on the next pane. Some Dot properties are shared with Color Density: Dot size, Dot order, Number, Show all dots, and Dot Filter. Changing them in one place will also change them in the other.
Dot size
This option controls how large each event (or dot) will be on the screen and printer. A size of 0 will display the smallest unit on the device. Other sizes are in points, a unit of 0.35 mm or 1/72 in.
Number
Enter the number of dots you want to display in the histogram window.
Note: The actual number of dots displayed may be less than the number you enter. If there are fewer events in the data than you specify, or if the packet size is less than the number of dots, fewer dots will appear.
In the second case where the packet size is smaller than the number of dots, you can display the full number of dots by replaying data for that histogram, or you can adjust the packet size to store the entire listmode file. See Edit Program Controls for further discussion of packet size.
Show all dots
By checking this option, all events will be displayed in the 2P histogram after replaying. See the note above for more on showing all dots.
Dot Filter
This option provides a means for visually eliminating dots in low-frequency channels of the plot. WinList will hide dots in any channel with fewer than the selected number of events.
Dot order
When using color event gating, this option controls the order in which dots are drawn. Unsorted draws dots in their natural event order based on the listmode acquisition. Low frequency on top draws the dots for the smallest populations last so that they can be seen on top of populations that have many events. It is useful for visualizing rare events. High frequency on top draws the dots for the largest populations last. It may be used to visually clean up low frequency events.
Color Density
Enable this option to display color-density dots.
This option will uncheck automatically if Dots are enabled on the previous pane. Some Dot properties are shared with Color Density: Dot size, Dot order, Number, Show all dots, and Dot Filter. Changing them in one place will also change them in the other.
Some Contour properties are shared with Color Density: Probability interval and Colors. Changing them in one place will also change them in the other.
Colors
Color mode
Choose either Color gradient or Rainbow mode. Color Gradient mode transitions from a starting color to an ending color as the number of events increases. Rainbow mode uses a set of colors which blend to define the color density levels.
Gradient start color
Choose a color to use as the starting color for color density dots and contours in Color Gradient mode. Click the color button to select a color
Gradient end color
Choose a color to use as the ending color for color density dots and contours in Color Gradient mode. Click the color button to select a color
Rainbow colors
Select the number of rainbow colors for Rainbow mode. By default this is 5.
Edit rainbow colors
Use this option to select colors used for Rainbow mode.
Contours
Enable this option to display probability contours.
Some Contour properties are shared with Color Density: Probability interval and Colors. Changing them in one place will also change them in the other.
Show outlier dots
To display dots that fall outside the first contour, check this option. The "Dots" section of this dialog controls the properties of the dots, such as size and number.
NOTE: If Enable contours and Show outlier dots are checked, the only dots drawn will be those that fall outside of the first contour level. To also draw dots that are inside the contours, uncheck the Show outlier dots option and check the Enable dots option above.
Probability interval
This value determines the probability used to compute contours. The default value draws 5% probability contours. With this setting, the largest contour level will contain 95% of the events in the histogram, the next level will contain 90%, and so on.
Base Contour
This dropdown list selects the level of the lowest, or base, contour. The level is selected as a percentage of events that it will include. The highest percentage, 99%, will include 99% of the events in the histogram. The lowest value for Base Contour is 90%.
Line weight
Choose a line weight for the contour border. The value is in points, a unit of 0.35 mm or 1/72 in.
Fill contours
When this option is checked, contours will be filled with colors defined in the Colors section. When unchecked, the contour is unfilled.
Smooth
Enable this option to smooth the histogram data used to create the contours. This creates contours that have fewer vertices and a rounder appearance.
Smoothing span
If the Smooth data option is enabled, this value determines how many channels are used in the smoothing algorithm. Using more channels creates rounder contours.
Colors
See the description of Color Density Colors for details.
OK
Click this button to accept the changes you have made and close the dialog box.
Cancel
Click this button to exit with no changes made and close the dialog box.
Apply
Click this button to apply the changes you have made and keep the dialog box open.