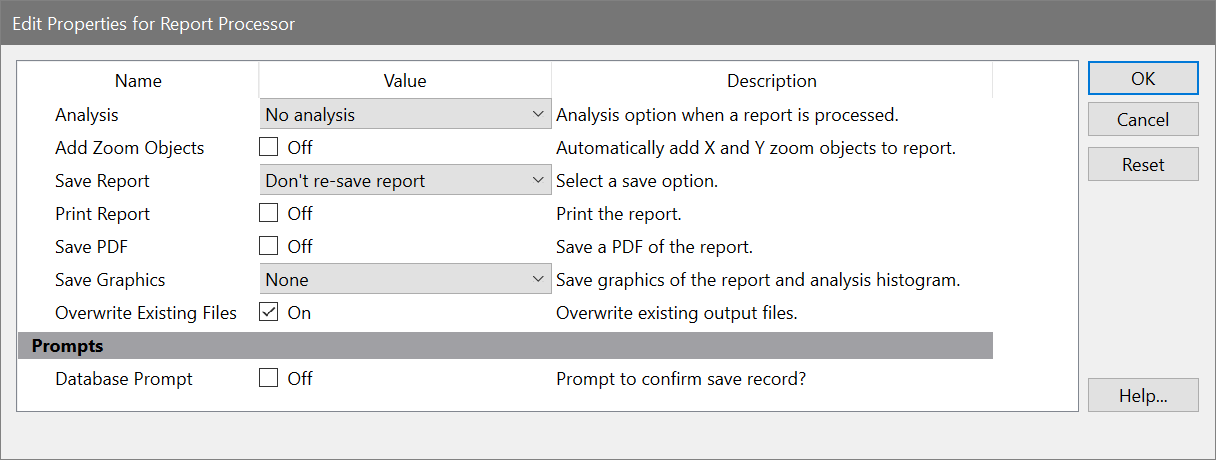

This option displays the Edit Properties for Report processor dialog box, allowing you to choose what happens during batch processing of reports. The dialog is displayed automatically when you select more than one report for analysis.

Batch processing options apply when you select more than one report in the Open Reports dialog box. When more than one report is selected, the Report Batch toolbar is displayed at the bottom of the application window. You can navigate through the batch one report at a time, or auto-advance through the batch of reports.
Analysis
Choose what analysis option you want to occur when a new data file is opened. The options available are listed below:
No analysis: No analysis is performed.
Auto-analyze: Automatic Analysis is run the data in the report.
Auto-analyze and Auto Linearity: Automatic Analysis and Auto Linearity are performed on the report data.
Fit with current model: The Execute Model command is executed on each data file.
Fit and AutoLinearity: An AutoLinearity adjustment is performed for each report, and the model is finally fit with the best linearity setting. See Using AutoLinearity for more on this option.
Add Zoom Objects
Enable this option to automatically add an X-Zoom and Y-Zoom graph to each report that is processed. These objects allow close examination of the low level events such as debris, aggregates, and S-Phase, and provide a magnified view of the area around the Diploid G1 peak.
Save Report
This drop-down provides three report saving options described below. Saving occurs after any analysis has been performed, and again when moving to another batch item.
Don't re-save report: The report is not resaved.
Re-save report: The report is resaved, using the save report name.
Auto-name and save report: The report is resaved using the Auto Save Report command. The name of the report may change from the original name with this option.
Print Report
Enable this option to automatically print the report to the current printer. Printing occurs when moving to another batch item.
Save PDF
Enable this option to automatically generate a PDF version of the report. The PDF is created in the same location as the Save Report Path.
Save Graphics
This option allows you to save graphics for the histogram or report. Graphics are automatically named based on the data file that is loaded, as described in Export Histogram Graphic and Export Report Graphic. The save operation occurs when moving to another batch item. The options available are listed below:
No: No graphics are saved to disk.
Histogram: Histogram graphics are saved.
Report: Report graphics are saved.
Histogram and Report: Both Histogram and Report graphics are saved.
Database prompt
Enable this option if you want to be prompted to store the analysis in any active databases. If you clear this checkbox and databases are active, records will be stored without prompting. If databases are inactive, this option is ignored.