
Research
and Compliance Mode note:
In RUO mode, all users can perform these tasks.
In Compliance mode, only ModFitAdmins
have permission to perform them.
The Peak Finder dialog adjusts the settings used by the system to determine how peaks will be identified in your samples. The peak finder statistically determines what populations are peaks in the histogram data, and then applies filters to remove unwanted peaks from consideration.
The peak finder is of fundamental importance in Automatic Analysis. Therefore, it is very important to approach changes to the peak finder with care and thoughtfulness.
Changes to these settings will affect how the program defines a peak, which in turn will alter ploidy detection, model selection, and analysis results in Automatic Analysis. Test any changes you make on a reasonable sampling of your data files. Make changes to improve the overall effectiveness of the peak finder, not to handle an exceptional sample. Exceptional samples should be handled using manual analysis.

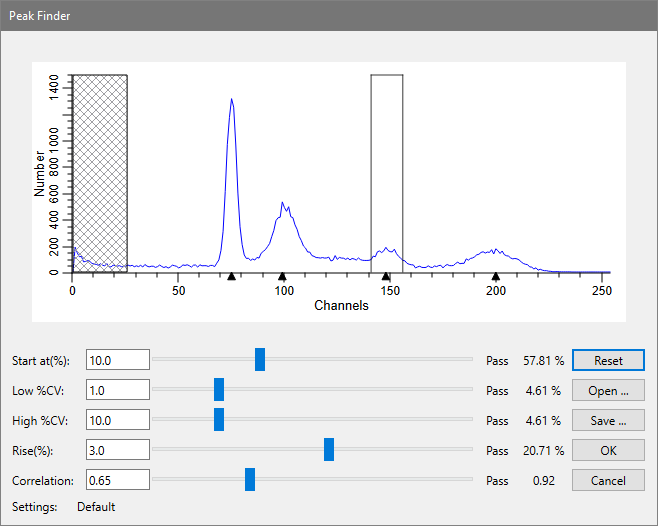
The dialog displays the analysis histogram. The graphic indicates the currently identified peaks with black triangles at the base of the histogram. In addition, there are controls that allow you to adjust the peak finder settings and see the effect immediately.
As you move your mouse pointer over the histogram, boundaries of peaks are drawn over the data, illustrated in the graphic above. The status of the peak for each criterion is shown next to the control for the filter. Using this information, you can determine why the peak finder excludes peaks, and make adjustments to the filters accordingly.
Start at
The value controls the point at which ModFit LT starts looking for peaks. It allows you to skip over channels where your data has debris that may be misinterpreted as a peak. The value is a percentage of the histogram scale, and higher values move the starting point to higher channel location.
Low %CV
This value controls the low %CV cutoff for data to be considered a peak. %CV reflects the broadness of the peak; those peaks which have %CV lower than this filter are excluded. To remove more narrow peaks, increase the value. To allow more peaks, lower the value.
High %CV
This value controls the high %CV cutoff for data to be considered a peak. %CV reflects the broadness of the peak; those peaks which have %CV higher than this filter are excluded. To allow more peaks to pass the filter, increase the value. To reduce the number of peaks that pass the filter, reduce the value.
Rise
This value controls how far a peak must rise above adjacent data to be considered a real peak. Peaks that extend above adjacent data less than this value are excluded from the peak finder. To increase the minimum rise for a peak and reduce the number of passing peaks, increase this value. To reduce the filter and allow more peaks to pass, reduce the value.
Correlation
This value controls the minimum correlation coefficient allowed for a peak to pass this "shape" filter. Each potential peak is fit with a Gaussian curve; the resulting correlation coefficient is compared to this filter. To increase the minimum allowable correlation coefficient and reduce the number of passing peaks, increase the value. To increase the number of peaks that pass the filter, reduce the value.
Open
If you have previously saved peak finder settings to disk, you can use the Open button to load those settings into the program. This is useful if you analyze sets of data that have different peak characteristics.
Save
Use this option if you want to store the current peak finder settings to a file on disk. The standard file save dialog box will be displayed, allowing you to navigate to a location and name the file to save.
Reset
Click this button to restore the peak finder values to the factory default settings.
OK
Click this button to accept the changes you have made and close the dialog.
Cancel
This option closes the dialog and discards any changes you might have made.
Help
This option displays the on-line help for this dialog.