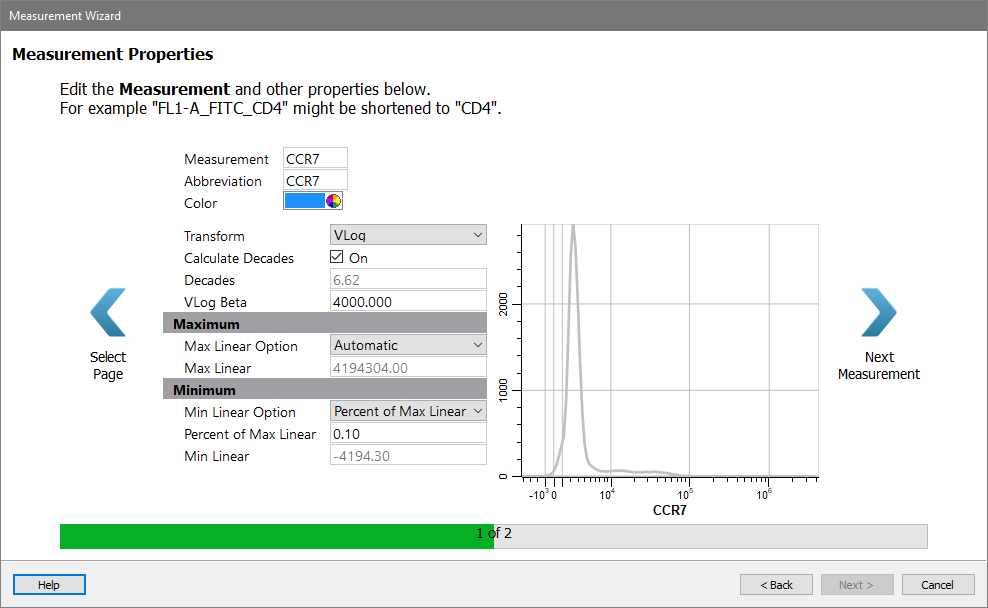
This page of the measurement wizard is used to adjust the properties of a measurement. It is shown for each measurement selected on the selection page of the wizard.

Properties for the measurement are shown on the left, and a preview of the measurement using those properties appears on the right.
Use the wizard's Next and Previous buttons to navigate through the selected measurements. When all selected measurements have been edited, the Next button at the bottom of the wizard will enable to allow the wizard to move to the Summary page.


Measurement properties
Measurement
Enter the name to use for this measurement.
Abbreviation
Enter an abbreviated form for the name.
Color
Select a color for the measure. This will be used in overlay plots.
Transformation Properties
Transform
Select a transform to use for the measurement.
Calculated Decades
When enabled, the program will compute the number of decades in the data. When disabled, the value in the Decades box is used.
Decades
When Calculated Decades is unchecked, this value can be adjusted to the desired number of decades. The program will scale data to the specified number decades.
VLog Beta
The Beta value for the VLog transform. Typically, this is 10.0.
Maximum
Max Linear Option
Choose Automatic to set the Max Linear value based on the resolution of the measurement. Choose User Defined to set a constant maximum value from file to file.
Max Linear
When Max Linear Option is set to User Defined, this value sets the maximum linear value for the measurement. When Max Linear Option is set to Automatic, this value is read-only, and shows the value being used as the maximum.
Maximum
Min Linear Option
This option determines how the the lowest value for the measurement is determined. Choose Percent of Max Linear to base the minimum value on the maximum value. Choose Percent of Area to based the value on a percentage of the area of the histogram. Or choose User Defined to set the Min Linear value directly.
Percent of Max Linear
Enter the percentage of the Max Linear value to use for the Min Linear value. Typically, this is 0.10%.
Percent of Area
Enter the percentage of the area of the histogram to use to determine the value that will be used for the Min Linear.
Min Linear
The minimum linear value for the measurement. This is dynamically computed if Min Linear Options is set to Percent of Max Linear or Percent of Area.