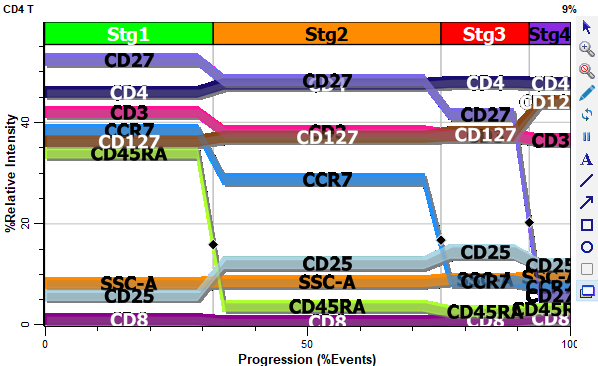

This tool allows you to create an overlay plot on the report or cell types. It is found on the Insert tab of the ribbon, as well as the toolbar for the report and cell type.
Once the tool is selected, click and drag on the report or cell type to create the object. Double-click the object to edit its properties.
The Overlay plot displays the modeled progression for all measurements in a cell type simultaneously.

The X-axis of the plot shows state or progression of a selected measurement, and the Y-axis shows relative intensity of the measurements in the plot.
If stages have been defined, they are displayed along the top edge of the ribbon display area.
Each measurement appears as a "ribbon" in the plot, with text labels identifying the measurement name. The color for each ribbon is determined by the Color property in the Expression Profile Properties panel.
Tools to manipulate the plot appear on the right edge of the plot window when the mouse is over the plot.
Context menu
The context menu can be displayed by right-clicking on the object.
Edit Graphics
Displays the Graphic Options for Overlays Plot dialog.
Edit Frame
Displays the Edit Frame dialog.
Copy
Copies the object to the clipboard.
Save
Displays the standard Save dialog to save the graphic object to disk.
Modeled Measurements Only
Enable this option to show only the modeled measurements - those with expression profiles - in the overlay plot.
Separate EPs
The command separates the expression profile ribbons to maximize the space on the overlay plot.
Reset EP separation
The command resets the separation performed with the Separate EPs command.