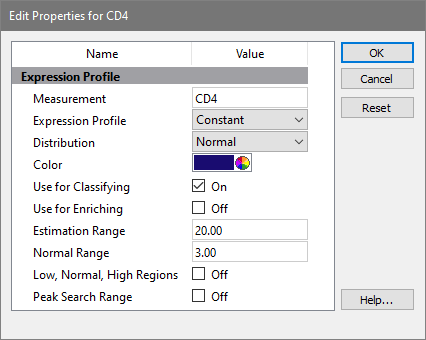
This dialog edits the most common properties for an expression profile. See Edit Profile Properties Panel for the full set of properties and descriptions.

Measurement
Enter a short name to use for the profile.
Expression Profile
Choose the type of profile to use for modeling this measurement. See Expression Profile Descriptions for a list of profile types.
Distribution Type
Choose the type of distribution to use for this profile. See Expression Profile Distribution Types for details.
Color
Select a color for this measurement. This color is used in Tri-COMs and overlay plots.
Use for Classifying
Check this option to include this profile in the modeling process.
Use for Enriching
Check this option to include this profile when using the Enrich command.
Estimation Range
This value restricts the estimation routine that adjusts Control Points on the parameter intensity (Y-axis) scale. The value is normalized to a 0 to 100 scale, so a value of 10 means that the estimation routine will consider moving a Control Point as much as 10% up or down if it finds a peak within that range.
Normal Range
The number of SDs that define the normal range. This is used with inverse distribution types and TriCOMs.
Low, Normal, High Regions
Shows all low, normal, and high regions in the data
Peak Search Range
Shows peak search range for the expression profile measurement.