WinList™
Welcome to WinList 10!
WinList - cytometry software designed to be both powerful and easy-to-use. WinList continues to raise the bar for data analysis with Cen-se' and t-SNE dimensionality reduction, 'magic contour' and 'sticky' regions, fabulous 3D graphics, and validated accuracy.
WinList reads all popular FCS files, including data from CyTOF and spectral instruments from Cytek and Sony. It delivers great region tools to highlight events and perform quick backgates. Easily design professional reports and overlays that update automatically. Create ratio parameters, equations, and alerts. Immuno-phenotyping, leukemia-lymphoma analysis, rare-event analysis, color gating, quantitative analysis- it's all possible with WinList.
 Windows 10+
Highlights
-
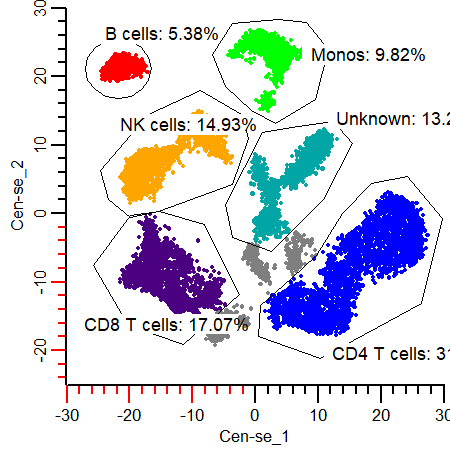
Cen-se' and t-SNE
Powerful dimensionality reduction
-
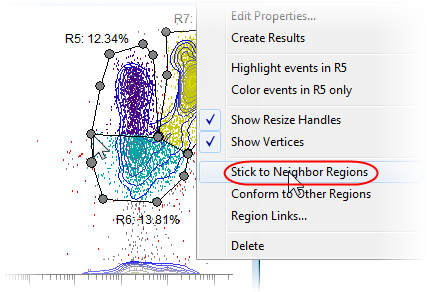
Sticky regions
Shared vertices, no double counting
-
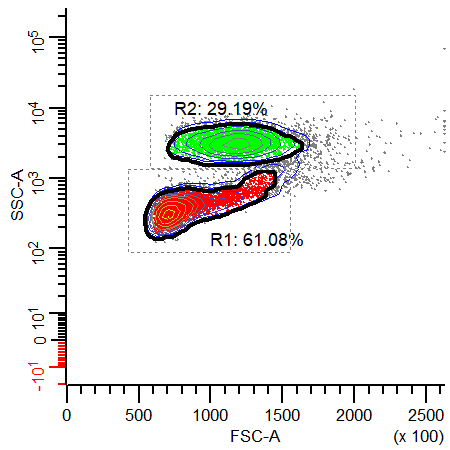
Contour regions
Create probability-based gate decisions
-
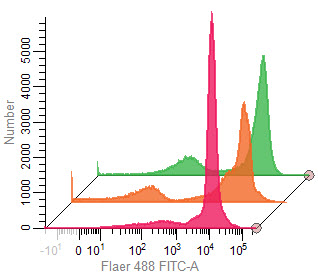
Overlay windows
Beautiful, publication-quality overlays
-
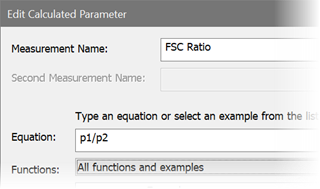
Calculated parameters
Ratios & lots of built-in functions
-
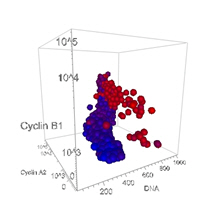
3D Viewer
OpenGL standard in WinList
-
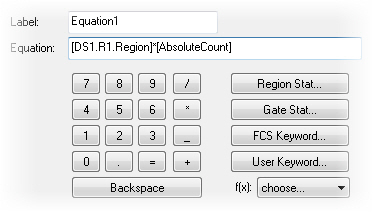
Equations and keywords
Add your own custom calculations
-
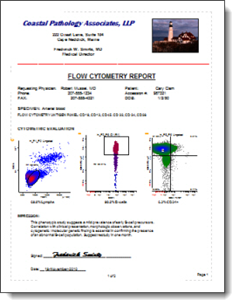
Enhanced report tools
Conditional updates, alerts, and PDF generation
-
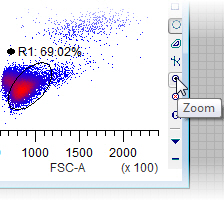
Data zooming
Reveal fine details of populations
-
Free WinList Reader
Share your analysis with anyone

-
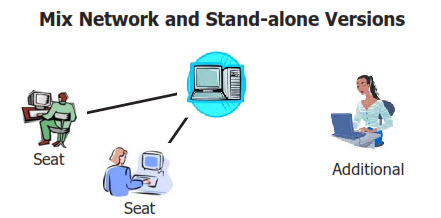
Network version
Affordable, flexible, and easy to manage
-
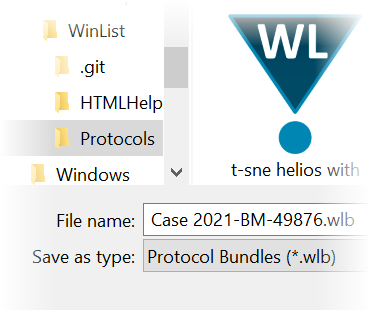
Zip-based archives
Easy sharing and archiving of analyses
-
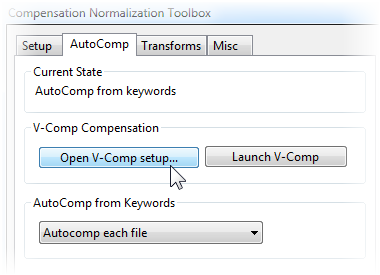
Integration with V-Comp™ app
Fully automatic and accurate compensation setups
-
Batch
Easy selection and advanced process control

-
Compensation review
The best way to evaluate compensation
Videos
Merging files and Cen-se' Analysis Webinar
Population Identification with Cen-se' and t-SNE
Contour Regions and Sticky Regions
WinList N-Color Compensation
WinList Basics
Using FCOM
Cascade Gating and Boolean Gates
Creating Reports
Using Overlays
More Info
User Interface
Creating an analysis workspace has never been easier. The new ribbon bar brings all the tools you need into easy reach, saving you clicks and precious time. The enhanced multiple histogram select dialog lists the parameter names in the listmode file. Select groups of 2-parameter histograms with a single click. Change histogram parameters directly using the parameter label drop-down list on the histogram. Region selection tools and gating options are right on the new histogram toolbar. Multiple analysis pages on each data source and multiple report pages give you virtually unlimited analysis display and reporting flexibility.
Customized reports
WinList has everything you need to create your own reusable report templates. Save your custom reports with formatted text and analysis information, including histogram graphics, results, and alerts. And of course, reports can be exported as PDFs with a click of a button.
Cen-se' & t-SNE Clustering for enhanced analysis
The Cen-se' and t-SNE algorithms perform dimension embedding that can reveal hidden relationships of markers in your data. Laurens van der Maaten's clustering algorithm - known as t-distributed Stochastic Neighbor Embedding or "t-SNE" is a simple calculated parameter in WinList. Cen-se' is a more robust enhancement of t-SNE. Both can be plotted in a 2P plot and gated. Regions can be draw on the plot and subsets seen in other plots. These are remarkable tools for understanding populations of cells in your samples.
Database and graphic output
Store analysis results in delimited-text database files or export directly to other programs like MS Excel, a feature designed to utilize automated batch analysis. Individual histogram graphics, the entire workspace, or even a copy of the report can be exported at publication quality as common graphic file formats.
Fast, accurate analysis
With WinList's flexible design, open any number of data files at the same time for viewing relevant parameter relationships across files. Create regions and apply gates in just a few clicks. Set up alerts to flag out-of-range results, and create reports that work in concert with the powerful batch analysis system. Multi-threading support leverages the multi-core processors on your computer to get your work done more quickly. No other FACS analysis software compares with WinList's full feature set.
N-Color™ Compensation
WinList has always had the easiest-to-use, most comprehensive tools for compensation. And now, it works seemlessly with Verity's stand-alone V-Comp™ app. V-Comp is an automated tool for creating perfect compensation setups that is incredibly easy and accurate. WinList knows where to find the setups V-Comp creates, so it's a snap to pick the setup you want and have WinList use if for your analysis. You can find out more about V-Comp here.
And of course, WinList still provides the fantastic capabilities of N-Color Compensation™ for manual and semi-automatic compensation, and reads the compensation settings from popular cytometer files. So you can start with the instrument compensation then adjust this compensation as needed. Turn compensation on and off with simple click of a button so you can easily see either the compensated or the uncompensated data.
Batch processing
Select a batch of data files and you can move through your WinList analysis with ease. Simple controls allow you to select specific files with a simple mouse click. Or, click the Auto-Advance button and the system will process all the files you selected for analysis. Use the elegant Batch Control dialog to select program operations using simple check boxes. Printing, data export, graphic export, databasing, and report export are just some of the powerful options available in the enhanced batch processor.
Product Testing
Frankly, it's embarrassing to hear how other companies "test" their products: ad hoc and haphazard at best. Before a new version of WinList is released, the software undergoes an extensive internal testing process to ensure that it performs as expected when it gets into your hands. We create "truth" data sets and require WinList to meet exacting standards. Over 20 test scripts, testing everything from reading files to printing reports, loading protocols to running macros, ranges to quadstats. And the numbers actually have to come out right or we don't release it for production. Simple as that.
Compensation Review Mode
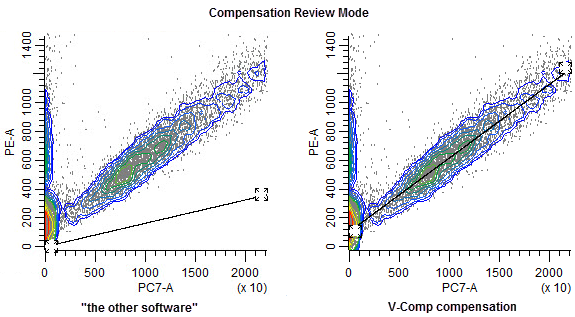
As we add more and more markers to our flow experiments, fluorescence crossover compensation becomes an increasingly important and fundamental component of data analysis. Wouldn't it be nice to be able to evaluate your compensation objectively? Compensation Review mode let's you do just that. It automatically zooms the data, temporarily flips to a linear display, and then shows the compensation settings with trace lines. A trace line should run right through the population's center, and you just can't see that with unzoomed, log plots. Naturally, WinList will let you fix the compensation if you find a problem.
Analysis Record
Create a complete record - a "bundle" - of every analysis with the click of a button. A bundle is a single compressed protocol file. This file contains all of the analysis windows, reports, results, regions, gates,even the data file, to allow you to reproduce your exact analysis of the data file.
Features
- Free 30-day Trial and WinList Reader allows you to share your analysis with anyone
- Multi-page reports that update automatically and produce PDF output
- Overlays for 1P and 2P plots - beautiful graphics that can be static or update automatically
- Auto-zoom on parameters to highlight the areas of interest
- N-Color Compensation™ - the first, and still the best
- Direct integration with Verity's stand-alone V-Comp app for hands-off automated N-Color Compensation.
- Network licensing options and the best pricing in the business
- WinList includes OpenGL 3D to provide enhanced graphics options for 2P and 3P histograms
- Cen-se' & t-SNE for finding hidden relationships in your data
- Database for reliable collection of analysis data
- Batch processing, multi-color analysis for high-throughput cytometry
- Create additional parameters and parameter ratios using a comprehensive list of algebraic functions
- User-defined keywords and equations allow you to create additional analysis results based on user input, regions, and other keywords
- Quantitative calibration system for MESF or ABC standardization
- N-Stat regions and region arrays
- PDF output of reports
- Export listmode and histogram data to FCS or text for use in other programs
- Link to ModFit LT and Microsoft Excel to extend analysis power
- Record and edit macros to automate repetitive tasks
- Archive your analysis with protocol bundles - a complete zip-compatible record
- Dozens of new features and fixes...
- For research use only. Not for use in therapeutic and diagnostic procedures.
Testimonials
"My laboratory recently switched to a new eight color flow cytometer. With the switch, we decided to adopt WinList as our new analysis software. I have found the software easy to use and comprehensive. We have easily set up protocols for all major work-ups, including panels for acute and chronic leukemias, lymphomas, FNA specimens and others. Patient data can be loaded into the protocols in batch, considerably reducing analysis time. Technical support has been first rate, with very quick response times and easily understood answers to all of our questions. All and all, I have been very satisfied with the product in all respects and highly recommend it."
Ronald Sirota, Pathologist
Lutheran General Hospital and ACL Laboratories
"Starting as a student in the lab of Dr. Cees Cornelisse in Leiden, The Netherlands, I worked with an ICP22 and had to calculate the DNA index and S-phase manually from histograms plotted on calibrated paper. The introduction of the FACScan allowed us to experiment with multiparameter DNA analysis. The combined use of WinList and ModFit was a blessing from the sky. Currently, we perform multiparameter DNA flow cytometry on a daily base using ModFit and WinList for analysis. Especially the collaboration with "The Guys from Verity" is inspiring and results in a continuum of sophisticated improvements of WinList and ModFit."
Willem E. Corver, PhD
Dept. of Pathology Leiden University Medical Center The Netherlands
"There are several software programs available that can be used to analyze flow cytometry data. I have used WinList since the very first version and found no other software as comprehensive and easy to use. For the analysis of multicolor data of any number of parameters, WinList version has it all."
Carleton C. Stewart,
Emeritus Director of
Roswell Park Cancer Institute
"We are a high volume, clinical flow lab with many WinList users, and we have tested all of the commercially available list mode analysis programs. Only WinList with its unstructured yet intuitive approach provides the robust flexibility, utility and reliability that allow us to get through our work efficiently."
David Miller, MD,
of USLabs
"I've been using WinList since version 2.0 (1992); I still have the original 5.25 inch floppy disks. I've never tried any other off-line analysis software because I've never had to. The technical support from VSH is unparalleled. The application does what I need, and in cases where it hasn't, Verity Software House has always addressed my concerns. Using this application is why I do flow cytometry; if I didn't have it to use, I'd be doing something else."
Marc Langweiler, DVM, PhD
"Software should never enter the equation when a researcher begins experimental design. With WinList the only limit is the researcher's imagination...."
Keith Shults
of InCellDx
"ModFit and WinList are two great flow cytometric programs, backed by a company with a strong commitment to customer service and satisfaction."
Paul K. Wallace, PhD,
Director of Flow Cytometry
of Roswell Park Cancer Institute
"I have been using WinList to perform listmode analysis of clinical flow cytometry cases for almost 20 years. To put it mildly, I can't imagine having to use another brand of software to take care of this very important procedure. I have tried other vendors analytical software and in my opinion WinList surpasses the rest in a number of different ways. For example, the Windows-based version has complete functionality that we are all used to, i.e. pull-down menus, right-left-click features, ease of use with other Windows-based software such as EXCEL and Word. Three words best describe how strong this software is:
1. Easy to use. Protocols that are simple to setup can be saved and for every panel you use whether it's 1, 3, or 20 files or more WinList analyzes, compiles the histograms and statistics, creates a beautiful multicolor report, and then you can print it, save it for retrieval later, or electronically export it into your labs LIS or other software program.
2. Flexible: whether you run a two-color instrument or a 13-color instrument it doesn't matter because WinList will handle an unlimited number of detected signals and allow infinite 1, 2, or 3-parameter histograms.
3. Fast: WinList analysis shortens our analysis time to mere minutes with the many functions and gating tools that can give you unlimited color printouts or electronic reports no matter how extensive or complicated the caseload is.
Probably the thing I like best about using WinList is the customer service and personal attention the folks at Verity provide. Whenever I have a question or need instruction on a new feature they are more than happen to assist me. You don't talk to an answering machine; instead, you get a live and friendly technical specialist that will be more than happy to assist you.
All you have to do is try it out. The answer to listmode analysis will be loud and clear. WinList is the best, hands-down."
Bruce Greig, MT(ASCP) QCYM,
of Vanderbilt University Medical Center
"WinList software has become a vital tool in all of our Poly-Chromatic Flow Cytometry applications. With advanced functions such as FCOM, for rapid transformation into Cluster analysis platforms, our lab can process and compare complex data in hours not months! Verity Software House has provided amazing customer and technical assistance that helped us get moving. Many thanks, VSH"
Daniel Haley, Flow Cytometry Specialist
of Providence Portland Health System
"Using WinList is like opening a treasure trove it is chockfull of special features that complement the basic operations. The program is fun to learn and easy to use. Most of all, the Verity Software House team is keenly responsive to users input."
Teresa S. Hawley, B.S.
of The George Washington University Medical Center
"WinList, wow! What an incredibly versatile and powerful tool! I came to my present position in 1994 as the director of the Nashville VA Clinical Flow Cytometry Lab and VA / Vanderbilt Flow Cytometry Research Core. My predecessor, Wayne Greene, introduced me to WinList at that time and I have used it almost exclusively since that time. I've given brief trials to several alternative FC softwares, but always find that WinList can perform all of the essentials as well if not better than the others.
Part of my job has been to instruct hemepath clinical residents in clinical flow cytometric analysis and interpretation of Leukemia and Lymphoma. WinList has been an incredible teaching tool for this purpose. I've saved literally hundreds of WinList MultiGraphs showing analytic examples of various Leukemia / Lymphoma disease processes. The MultiGraphs are color coded to show gating selections and provide a ready library of examples instantly ready to be shared with residents. WinList histograms, dot plots, and/or results can easily be dropped into PowerPoint for that last minute presentation, or saved in MultiGraphs until you're ready to compile graphics for your clinical or research paper a great time saver.
WinList has also been an excellent solution for analysis of research data for the hundreds of investigators that have used our core over the past 15 years. WinList is so intuitive. Compared with some of the other softwares I've tried, WinList takes very little time to become productively proficient. So, as I've gotten busier over the years, I've encouraged any researcher I can to do their own analysis. Within an hour or two of training, they are off on their own: constructing and saving protocols, batching data, constructing Boolean gates, back gating, color coding, selecting histogram style (dots, 3D rotation, isopleths, density gradients, etc), selecting statistics, saving MultiGraphs, producing overlays, and saving data for presentations / publications. Another powerful tool is the unique interface of WinList with ModFit. Many researchers have combined these two programs to simultaneously evaluate Tunnel assays, or cyclins or oncogenes, or other protein expressions together with DNA Cell Cycle. I generally find that the only limiting factor is my imagination. I give WinList my highest recommendation it's great!"
Jim Price, Ph.D.
of
Vanderbilt University & VA TVHS Nashville
