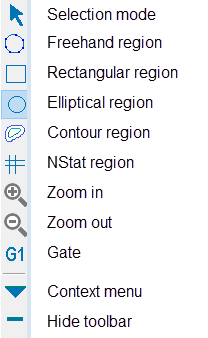
This toolbar appears inside the right edge of the active histogram window. Each icon represents a tool, described below.
Region Modes
The first group of tool buttons is used to select a region drawing mode, with only one mode active at a time. Regions are drawn by pressing and holding the left mouse button when the cursor is inside the histogram, and moving the mouse to define the size and shape of the region. For 1P histograms, only the Select and Range modes are supported. 2P Histograms support Select, Freehand, Rectangle, Ellipse, and Contour modes. Currently, no region drawing is supported for 3P histograms.
Select mode
In this mode, regions can be selected and moved, but new regions are not created when the left mouse button is clicked on the histogram.
Range (not shown, 1P histograms)
The Range tool appears on 1P plots to draw a range region. Click, hold, and drag to create a range in a 1P histogram.
Freehand mode
Click, hold, and drag to create a freehand region in a 2P histogram. To complete the region, release the mouse button on the starting vertex of the region. Alternatively, click and hold for 1 second to define the first vertex, and then release the button. Define additional vertices by clicking the mouse.
Rectangle mode
Click, hold, and drag to define the boundaries of a rectangular region in a 2P histogram.
Elliptical mode
Click, hold, and drag to define the boundaries of an elliptical region in a 2P histogram.
Contour mode
With a Contour region, a bounding rectangle is defined with the mouse, just as with Rectangle mode. Once that rectangle is defined, WinList computes a contour on the data within that rectangle. Each time the data in a histogram changes, the contour region will recompute based on the data in that rectangle.
NStat region
This button initiates the creation of an NStat region in a 2P histogram. An NStat is similar to a QuadStat, except that it can have any number of rows and columns, and its vertices can be moved independently to change the shape of the array.
Zoom in
Click the button to define a zoom area on the histogram. The histogram enters "zoom" mode. Click inside of the histogram and drag to define the zoom area. When the mouse is released, the histogram displays only the portion within the zoom area.
Reset zoom
Use this button to reset the zoom on a histogram.
Gate
This button displays a list of the gates that can be applied to the histogram. Select an item in the list to apply a gate to the histogram.
Context Menu
This button displays the histogram Context menu containing additional commands relevant to the histogram.
Hide
This button hides the histogram toolbar. The toolbar will reappear when the histogram is reactivated by clicking on its titlebar.