This dialog box allows the user to perform histogram subtraction, where the control (negative) histogram is selected and subtracted from the current active (test) histogram. The dialog box can be accessed through the Edit Histogram dialog box, or from the histogram popup menu that appears when the right mouse button is clicked on a histogram. Only 1-parameter histograms are supported.
Often the two histograms are in separate listmode files; the control histogram is in one and the test histogram in another. In order to subtract one from the other, both files must be opened at the same time. One way to accomplish this is to set up a protocol with two data sources. Use the Duplicate Data Source option in the Create menu to easily set up a second data source.
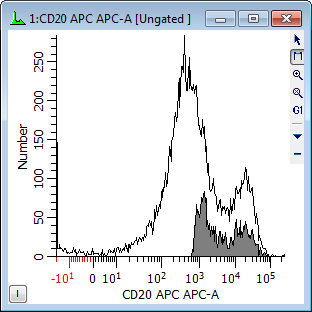
When activated, WinList will change the graphical display of the target histogram so that the outline of the original histogram appears, and the histogram resulting from the subtraction is displayed in the foreground. The title bar of the histogram will indicate that subtraction is on. A sample display is shown below.
When the subtract histogram command is selected, the following dialog box appears.
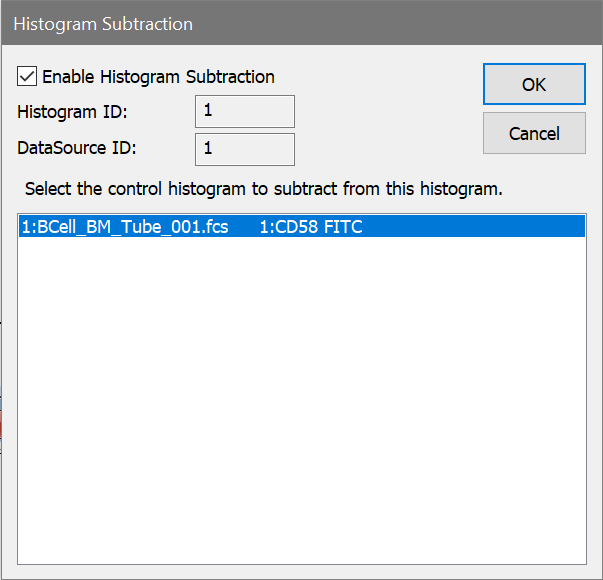
To subtract a histogram from the current histogram, select the negative control histogram that you want to subtract from the list box. All 1-parameter histograms in all open data sources will appear in the list box. Make sure that the Enable Histogram Subtraction option is checked and then click OK.
To disable histogram subtraction, clear the check from the Histogram Subtraction On check box.
There are times when you may receive a warning indicating that the histograms may be reversed. This message alerts you to a condition in the subtraction routine where the control histogram may have more "positives" than the positive histogram. Check to make sure you have not accidentally subtracted the positive histogram from the negative histogram or made a similar selection mistake. If you are certain that you are subtracting the correct histogram, the warning can be safely ignored.
Enable Histogram Subtraction
This option determines the state of histogram subtraction. When checked, subtraction is enabled. When unchecked, subtraction is disabled. It is checked automatically each time you display the subtraction dialog.
Histogram ID
This field displays the WinList ID of the histogram to subtract that is currently selected in the list box.
Data Source ID
This field displays the WinList ID of the data source owning the histogram that is currently selected in the list box.
Histogram list box
Displays a list of all 1-parameter histograms.
OK
Accepts changes and closes the dialog box.
Cancel
Exits with no changes and closes the dialog box.
Statistical results of the subtraction can be viewed by clicking the I button in the lower left corner of the histogram window. When clicked, an information window will appear displaying several statistics as described below:
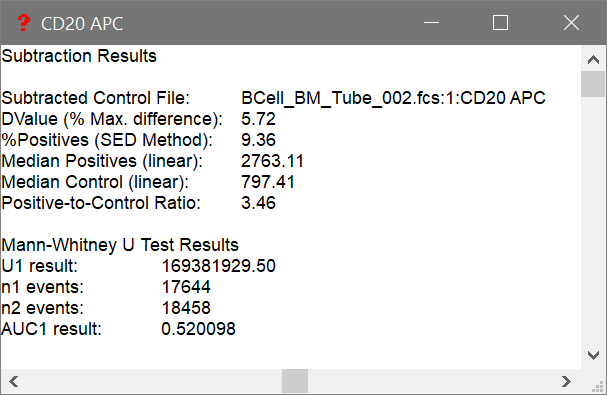
These results are also available for databasing.
Subtracted Control File
This field displays the name of the data source, the histogram ID, and the name of the subtracted control histogram.
DValue (% Max. difference)
In determining the difference between the test and control histograms, both are converted into cumulative histograms and normalized to a scale from 0 to 100. The point of maximum difference is found and the percent difference is calculated. Since the scale of the cumulative histograms is 0 to 100, the maximum difference is actually a percentage.
% Positives (SED Method)
This statistic uses the Super-enhanced DMax (SED) method to determine a more accurate percentage of the test histogram that is positive, or what portion remains after histogram subtraction. The method was presented at ISAC in 1996 as Enhanced Normalized Subtraction (ENS), and was further improved to become SED. Contact Customer Support for other references and a white paper on this method.
Median Positives (linear)
This field displays the statistical median for the positive distribution computed using the SED method. It is in linear ADC units.
Median Control (linear)
This field displays the statistical median for the control histogram. It is in linear ADC units.
Positive-Control Intensity Ratio
This field displays the ratio of the linearized positive median to the linearized control median. It provides an indication of the relative intensities of the positive and control distributions.
Mann-Whitney U Test Results
WinList computes the Mann-Whitney U Test for additional "Area-under-the-curve" (AUC) statistics for histogram subtraction. Detailed info on this test can be found in this wiki article. This provides another indication of the difference between two distributions - the test and control histograms.
The key statistic is the "Area-under-the-curve", or AUC. AUC is non-parametric and ranges from 0 to 1, such that if the histograms are the same AUC = 0.5. If test histogram shifts to the right, AUC will increase towards a value of 1.0, and if the test histogram shifts to the left, AUC decreases towards a value 0.0. The AUC as a metric gives both the proportion of difference between histograms and direction of shift. AUC seems to be very robust and not affected by noise.