A MultiGraph is a window that can display multiple histograms and results windows in various arrangements. The histograms can be from different data sources, and they can be a mix of 1, 2, and 3 parameter. MultiGraphs can be saved to disk, reopened and new histograms and results windows can be added to them, making them useful for archival storage. Each histogram in the MultiGraph may have a label assigned to it which can be positioned anywhere in the MultiGraph window. You can choose from several different views of the histograms, and change the views easily. See Create MultiGraph for more information.
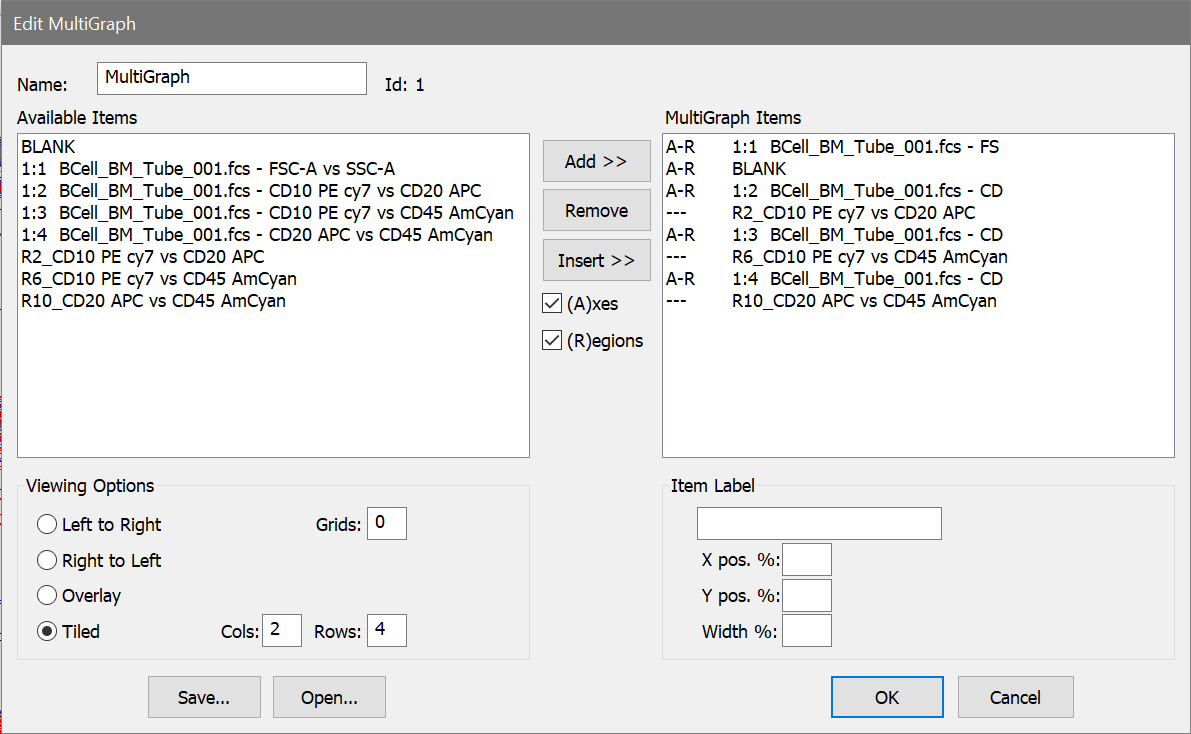
To display this dialog, choose Edit from the MultiGraph context menu or double-click the MultiGraph's title bar.
Name
Enter a name for the MultiGraph window. You can enter text, or type a keyword enclosed in square brackets.
Available Items
Displays a list of all histograms in all data sources currently opened in WinList, as well as the results windows. This is a multiple selection list box, so you can select the name of the histograms and results windows you want, drag the mouse in the list box to select a range, then click the Add button to add those histograms to the Selected Items list. An additional entry, BLANK, allows you to insert a placeholder with no graphic. This can be useful if you have a wide results window and want to allow it more room on the MultiGraph in a tiled view.
MultiGraph Items
Displays a list of histograms existing in the MultiGraph and those you want to add to it. It is a multiple select list box. You can click the left mouse button and multiple select the histograms you want to remove or edit. The first three characters in each entry of this list indicate the states of the Axes and Regions check boxes. The MultiGraph entries will include or exclude the X and Y-axes, and any regions that are within the histograms based on these characters. For example, if an entry in Selected Histograms starts with A-R, axes and regions will be included in the MultiGraph.
Add
This button copies the histograms currently selected in the Available Items list box into the MultiGraph Items list box. As histograms are added, the state of the check boxes Axes and Regions is also copied for each item added.
Remove
This button deletes the highlighted items from the MultiGraph Items list box and subsequently from the MultiGraph.
Insert
Use this button to add items from the Available Items list box in front of the currently selected item in the MultiGraph Items list box.
Axes, Regions
These check boxes determine whether x and y axes, and regions will be displayed for items as they are added to the MultiGraph Items list box. If Axes is checked, the letter A will appear as the first character in the MultiGraph Items entry. If it is not checked, a hyphen (-) will appear. Similarly, R will appear for regions. Once the OK button is clicked, these options become permanent for the selected histograms.
Viewing Options
Radio buttons allow you to select from several viewing arrangements: Left to Right, which stacks the histograms from the upper left to the lower right, Right to Left, which stacks from upper right to lower left, Overlay, which allows histograms to be superimposed on one another, and Tiled, which provides a row-column arrangement. If you select Tiled, the Col and Rows edit boxes allow you to control the row-column arrangement. Setting Rows to 0 will fit all elements of the MultiGraph onto one page. Setting Rows to a positive number will display a maximum of that many rows per page, in some cases creating a multiple page printout. For Left to Right and Right to Left, the edit box Grids allows you to lay down evenly spaced grid lines connecting the bases of the histograms.
Label
This group of controls allows you to enter a label for each item and to determine its size and position on the MultiGraph. The label may include up to 80 characters of text.
Labels can include any FCS keywords embedded in the data file and internal WinList keywords. Keywords must be surrounded by square brackets []. Keywords are only evaluated at the time the elements are created.
See Internal Keywords for more on keywords.
Examples of labels:
[HISTOGRAM] [GATE] [DATE]
displays name of the histogram, the gating information, and today's date
[FILE] contains [R('3,PERCENT')] percent positives
displays the name of the file and the percent of region R3.
[$SAMPLE] [$PROJ]
displays the FCS keyword values for $SAMPLE and $PROJ.
Label position and width
The X and Y positions and the width can be entered in these edit boxes. The numbers are in percentage of the windows where 0 percent x and y is the lower left corner of the window, and 100 percent x and y is the upper right. X and Y positions determine the origin of the label. The width, again in percent, determines how wide the label can extend. Usually, the width and the x position values should not add up to more than 100 or the label will spill out of that histogram's portion of the MultiGraph.
Save and Open
These push buttons allow you to save MultiGraphs to disk, or reopen existing MultiGraphs. Opening a MultiGraph from disk will replace any histograms in the current MultiGraph.
OK
Click OK when you've made your changes and selections and the new MultiGraph elements will be generated. The amount of time to generate a MultiGraph depends on how many elements you have selected and how complicated each one is.
Cancel
The Cancel button allows you to undo the changes you have made. In some cases it is grayed out, indicated that you cannot cancel the operation. This occurs if you are editing an existing MultiGraph and you remove one or more of the histograms from the Selected Items list box. Removing existing items is not a recoverable operation.