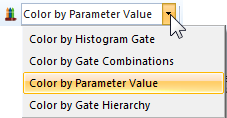

The Home tab of the ribbon bar includes a drop-down control that allows you to select different coloring modes for WinList. Color modes mostly affect 2P histograms that are display Dots, but also have an impact on 1P and 3P histograms.
Four color modes are available:
Color by Gate Hierarchy
This is the default coloring mode. In this mode, dots are assigned the color of the last gate in the gate hierarchy that they belong to. Typically, this means that the dot color is the color of the most refined subset. See Edit Color by Gate Hierarchy for additional details.
Color by Histogram Gate
In this mode, dots are assigned the color of the gate that is applied to the histogram. This mode makes it easy to see how a histogram has been gated.
Color by Gate Combinations
Similar to Color by Gate Hierarchy, this mode adds colors of the gates that classify the dots. It creates new colors for events that fall into more than one gate. This mode works well when only a few gates are used and there is not much overlap between them. See Edit Color by Gate Combinations for details.
Color by Parameter Value
In this mode, one parameter is selected to be used to color dots. The intensity of that parameter for each event determines the color of dots representing that event. It effectively adds information from a third parameter to every 2P histogram. See Edit Color by Parameter Value for details.