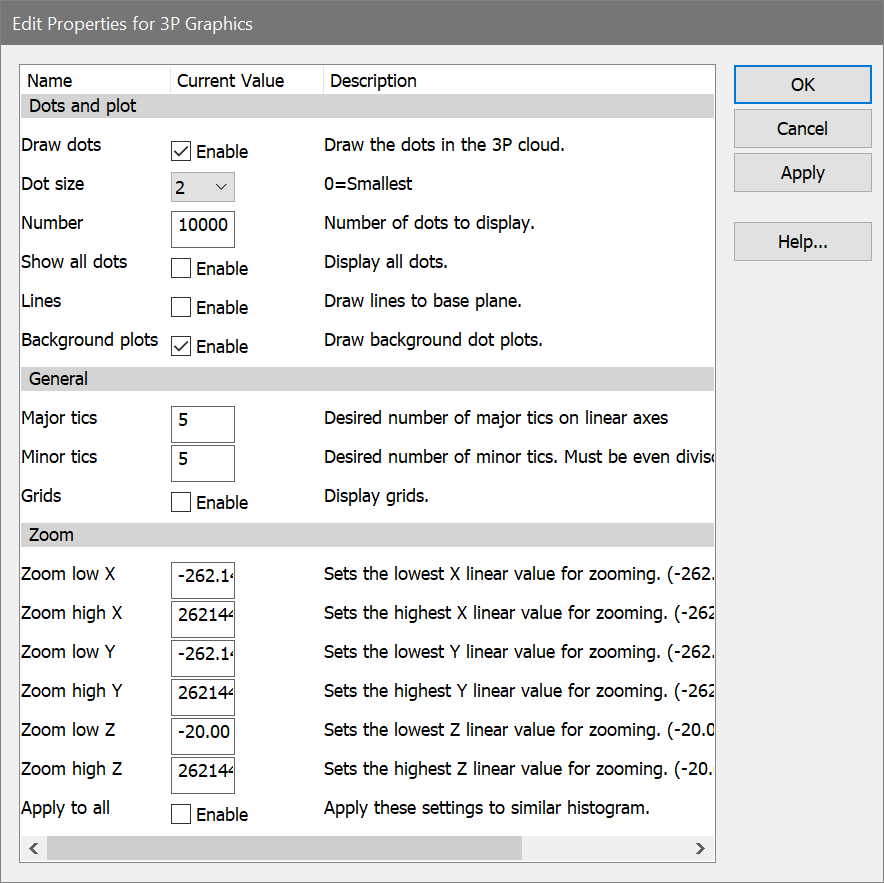
This dialog allows you to change the graphical display of a 3P histogram.
Dots and plot
Dot size
This option controls how large each event (or dot) will be on the screen and printer. A size of 0 will display the smallest unit on the device. Other sizes are in points, a unit of 0.35 mm or 1/72 in.
Number
Enter the number of dots you want to display in the histogram window.
Show all dots
By checking this option, all events will be displayed in the 3P histogram after replaying. See the note above for more on showing all dots.
Lines
When this option is enabled, line gray lines are drawn from each dot to the base plane. When displaying 1000 dots or fewer, this is useful to identify the position of dots.
Background plots
When this option is enabled, a bivariate dot plot is drawn for the 3 background planes.
General
Major Tics
Enter an approximate number of major tics you want to appear on the axes. Major tics are always divisible by 10, so the actual number of major tics may not be equal to the value entered here.
Minor Tics
Enter the approximate number of minor tics you want to display. The actual number displayed will be 2, 5, 10 or a multiple of 10.
Grids
This check box allows you to turn on or off the display of grids that appear on the major tic intervals. If the box is checked, grids will be displayed.
Zoom
Zoom low X
This value defines the lowest X parameter value that is shown in the histogram. Values that are below this are ignored.
Zoom high X
This value defines the highest X value shown in the histogram. Values above this are ignored.
Zoom low Y
This value defines the lowest Y parameter value that is shown in the histogram. Values that are below this are ignored.
Zoom high Y
This value defines the highest Y value shown in the histogram. Values above this are ignored.
Zoom low Z
This value defines the lowest Z parameter value that is shown in the histogram. Values that are below this are ignored.
Zoom high Z
This value defines the highest Z value shown in the histogram. Values above this are ignored.
Apply to all
When this option is enabled, the settings for the selected histogram will be applied to all other 3P histograms when the OK button is clicked.
OK
Click this button to accept the changes you have made and close the dialog box.
Cancel
Click this button to exit with no changes made and close the dialog box.
Apply
Click this button to apply the changes you have made and keep the dialog box open.