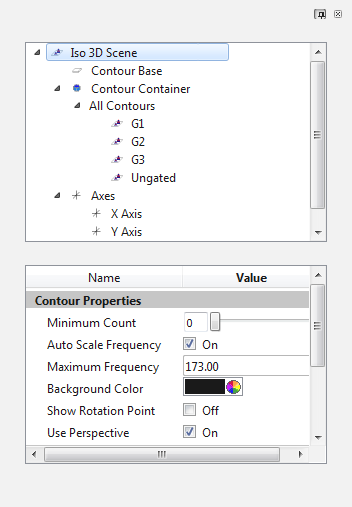
This property sheet allows you to change how the 3D-viewer window displays 2-parameter data.

A pushpin at the top of the sheet allows you to pin the sheet open. The small "x" allows you to close the sheet.
The tree control at the top determines which set of properties are shown in the bottom section. Select an item in the tree to view and edit its properties.
Iso 3D Scene
Contour Properties
Minimum Count
Use this control to filter out low-level populations. Those that have fewer events than this value will not be drawn on the plot.
Auto Scale Frequency
When checked, the frequency axis is automatically scaled based on the data.
Maximum Frequency
When Auto Scale Frequency is not checked, the this field sets the height of the frequency axis.
Background Color
Select a background color for the viewer.
Show Rotation Point
Enable this option to see the point at the center of rotation.
Use Perspective
Enabled by default, this property determines whether perspective is applied to the 3D rendering.
Copy/Save/Print Options
Custom Size Width & Height
These values control the width and height for graphics when copied, saved, or printed.
Image Resolution
This field controls the resolutions for graphics when copied, saved, or printed.
Use White Background
Enable this option to use a white background when copying, saving, or printing.
Contour Base
Show Base
Enable this option to show the base plane of the contour plot.
Base Color
Choose a color for the base plane.
Percent Transparency
Choose a transparency for the base.
All Contours
These settings apply to ALL of the subset contours. Individual contours can be customized with different settings.
Contour Line Type
Select an option for displaying contour lines.
Minor Tic Contours
When contour lines are enabled, this option will draw contour lines for the minor tic levels.
Contour Line Color
Choose a color for the contour lines.
Percent Transparency
Choose a transparency for all contours.
Contours
Use these objects to customize individual clusters. To change the settings for all contours at once, select the All Contours object in the tree.
Contour Line Type
Select an option for displaying contour lines.
Minor Tic Contours
When contour lines are enabled, this option will draw contour lines for the minor tic levels.
Contour Line Color
Choose a color for the contour lines.
Percent Transparency
Choose a transparency for all contours.
Contour Color
The property displays the color used by the cluster. It is control by the gate dialogs in the main application.
Axes
Show Box
Enable this option to show the 3D box.
Box Line Weight
Choose a line weight for the 3D box.
Box and Axis Color
Choose a color for the 3D box and axis.
Y, Y, Z Axis
Show
Choose an option for the axis display.
Axis Color
Select a color for the axis.
Label Font
Select a font for the axis label.
Number Font
Select a font for the axis numbers.
Axis Line Weight
Select a line weight for the axis.
Axis Label Properties
Axis Label
Edit the text for the axis label.
Update Axis Label
Select an option for how the axis label is updated.
Axis Label Style
Choose a label style. 3D Fixed maintains the same label orientation as the plot is rotated. 3D Facing Viewer rotates the labels to face the viewer and remain readable as the plot is rotated.
Horizontal Alignment
Choose an alignment for the labels.
Axis Number Style
Choose a style for the axis numbers. 3D Fixed maintains the same label orientation as the plot is rotated. 3D Facing Viewer rotates the labels to face the viewer and remain readable as the plot is rotated.
Show Exponent Only
When enabled, only the exponent is shown on the axis for log-like transforms.
Axis position
Select a position for the axis.