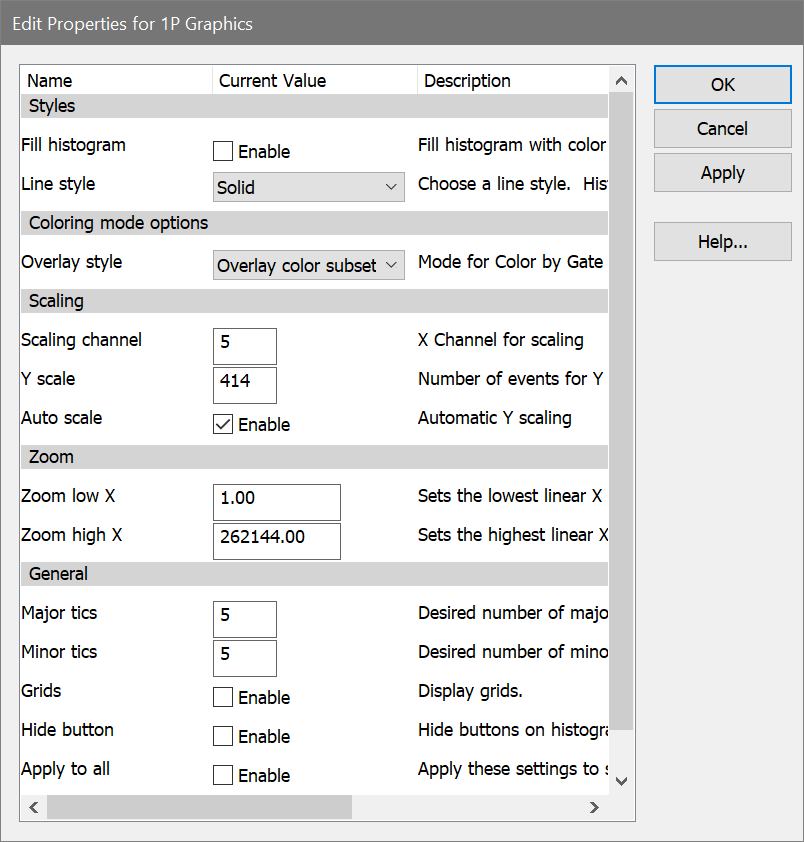
This dialog allows you to change the graphical display of a 1P histogram.
Styles
Fill histogram
This check box determines whether this histogram is filled with color or drawn as an outline. The default setting for this comes from Preferences - Graphics.
Line Style
This option allows you to assign a line type to the border of the 1P histogram. Six line types are supported. Click the scroll bars to select a new style. As you click, the new style is displayed for previewing.
Coloring mode options
Overlay style
When a color gating mode is used (i.e. Color by Gate Hierarchy or Color by Gate Combinations), a 1P histogram can display population subsets. The subsets can be stacks or overlays. Use this option to select how to display subsets for the 1P histogram.
Scaling
Scaling channel
Enter a channel number to define where the program will start looking for the peak channel in the histogram. This is useful if your data has an accumulation of events in low channels that should not be considered when looking for the peak. WinList uses the peak height to scale the histogram when the Auto Scale option is enabled.
Y Scale
If the Auto Scale is enabled, this edit box displays the highest peak value for the histogram. To set a value manually, uncheck the Auto Scale option, and then enter a number to set the highest value on the Y-axis of the histogram.
Auto Scale
If checked, WinList sets the vertical, y-axis scale of the histogram to the highest peak value. It will look for peaks starting at the channel set in Scaling channel. If Auto Scale is unchecked, the number in the Y Scale edit box determines the scale of the y-axis of the histogram.
Zoom
Zoom low X
This value defines the lowest parameter value that is shown in the histogram. Values that are below this are ignored.
Zoom high X
This value defines the highest value shown in the histogram. Values above this are ignored.
General
Major Tics
Enter an approximate number of major tics you want to appear on the axes. Major tics are always divisible by 10, so the actual number of major tics may not be equal to the value entered here.
Minor Tics
Enter the approximate number of minor tics you want to display. The actual number of displayed will be 2, 5, 10 or a multiple of 10.
Grids
This check box allows you to turn on or off the display of grids that appear on the major tic intervals. If the box is checked, grids will be displayed.
Hide button
Check this option to hide the "Info" button. Info buttons appear in histograms that have remote links or histogram subtraction results.
Apply to all
When this option is enabled, the settings for the selected histogram will be applied to all other 1P histograms when the OK button is clicked.
OK
Click this button to accept the changes you have made and close the dialog box.
Cancel
Click this button to exit with no changes made and close the dialog box.
Apply
Click this button to apply the changes you have made and keep the dialog box open.