Flow cytometry data analysis focuses on identification of populations in a sample and providing statistical results about those populations. Typically, regions drawn on plots are used to create a hierarchy of subsets by "gating" the events. The subsets are analyzed for frequency, intensity, and other common statistics to characterize the cells that were analyzed.
GemStone approaches data analysis quite differently by using a Probability State Model (PSM) to identify and quantify subsets. So what is a Probability State Model, and why is it a better approach?
Let's examine the words that make up the name to get an idea of what a PSM is:
Probability: the statistical likelihood of a particular event occurring. A PSM classifies events using probabilities rather than gates. Gating is subjective, and relatively small errors made in drawing gates are compounded with each subsequent gate in the hierarchy. By using probability, a PSM actually reduces the error with each additional measurement that is added to the model. The likelihood that you are actually identifying the cells you are interested in increases as you build a PSM.
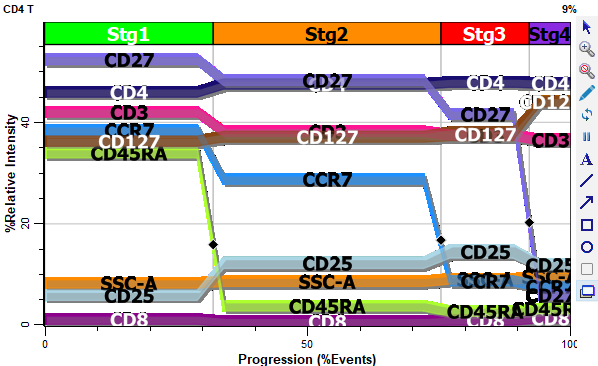
State: a set of conditions that discretely characterize something. A PSM classifies events into a set of states, based on the characteristics defined for each measurement. GemStone uses the state as the common, X-axis for its expression plots. This allows all measurements to be compared on a common axis, making it possible to correlate all measurements in a single plot.
Model: a mathematical representation of a process. A PSM uses fitting routines to classify cells into the most probable states and cell types. Using this approach, GemStone can provide objective assessment of how well the model represents the data. There are no hard-edges in a PSM. The modeling process allows populations to overlap based on probabilities.
A PSM allows us to classify events into populations based on a model that we define. The model is made up of one or more cell types, where each cell type defines a subset that we want to analyze. We use what we know about the markers in our experiments to create a set of expression profiles for each subset. An expression profile uses a set of control points to define how the subset transitions over the state axis. The state axis is typically labeled "Progression", but it does not have to be a progress at all. In fact, simple models can be designed to identify and quantify cell populations where the parameter profiles are simply set for constant intensities.
With the PSM approach, we can measure and report confidence limits. We can evaluate the goodness-of-fit with reduced chi-square (rcs). And we can co-plot our parameters in a single graphic that allows us to examine the coordinated transitions of markers in the cells we analyze.
