Research
and Compliance Mode note:
In RUO mode, all users can perform these tasks.
In Compliance mode, only ModFitAdmins
and ModFitEditors have permission
to perform them.

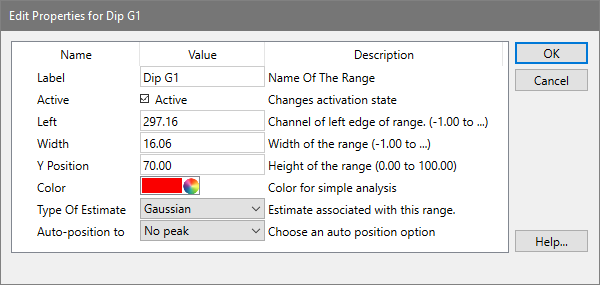
This dialog allows you to edit the properties of a model range. Ranges are graphical elements that you can position on the histogram, used to supply estimates to model components.
Label:
This edit box displays the name of the range. It can be edited by click inside the edit box and typing new text.
Active:
When checked, the range is displayed on the histogram (in Range view) and it can be used as an estimation source for model details. When unchecked, the range will not be displayed and any components that use the range will be deactivated.
Left:
The edit box shows the location of the left side of the range. You can edit the field manually, or position the range graphically to change the value. To display ranges, click the Range button on the toolbar, or choose Position Ranges from the Analysis menu.
Width:
The edit box shows the width of the range. The right side of the range is positioned at Left plus this value.
Y Position:
This value determines the vertical location of the range label. The value is a percentage of the Y scale.
Color:
Click this button to display the standard color selection dialog and choose a new color for the range.
Type of estimate:
There are three types of range estimates: Gaussian, Debris and Aggregate. Most ranges are Gaussian type, used to identify peaks in the histogram. There is typically only one Debris estimate range in a model, used by the AutoDebris component for estimation of the debris. The Aggregate estimate can be associated with the AutoAggregate component, but is typically not used.
Auto-position to:
In most models, the ranges are positioned and sized by the user for manual analysis. Automatic analysis positions ranges based on the peaks it finds in the data. However, you can create your own custom models, too, and for those models you can tell ranges how to position themselves.
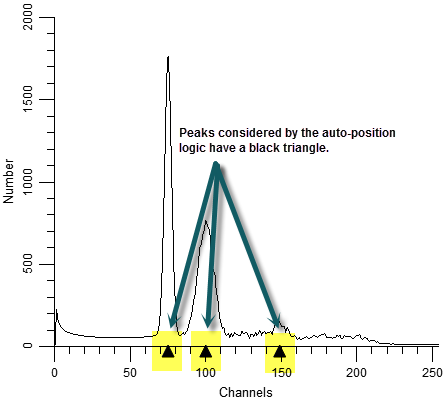
The peaks that are considered by the auto-positioning logic are those that show a black triangle on the main histogram.

No peak: This turns off auto-positioning and leaves the range where it is.
Closest peak: Moves the ranges to the closest peak.
Dimmest peak: Moves the ranges to the dimmest peak.
Brightest peak: Moves the ranges to the brightest peak.
Largest peak: Moves the ranges to the largest peak (by area).
Smallest peak: Moves the ranges to the smallest peak (by area).
Tallest peak: Moves the ranges to the tallest peak.
Shortest peak: Moves the ranges to the shortest peak.
OK:
Click this button to accept the changes and close the dialog.
Cancel:
Click this button to cancel changes and close the dialog. This button may be disabled if changes are made that cannot be cancelled.
Help
Click this button to display online help for this topic.