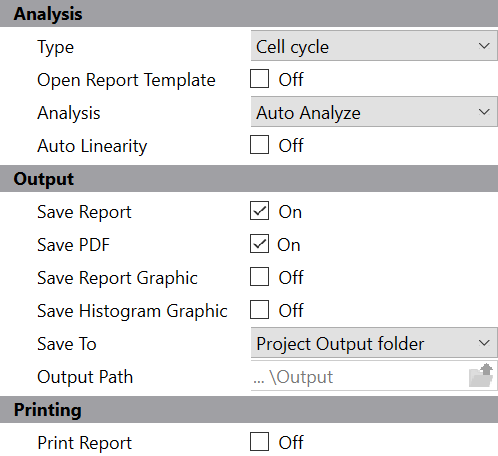
These properties determine what actions the program will perform when processing FCS files in the batch list. They appear at the bottom of the batch list panel on the left side of the main window.

Analysis
Type
The Type identifies the kind of analysis you want to perform:
Type |
Usage |
Cell cycle |
Cell cycle analysis using Auto-Analysis or a model created with the Choose Model dialog. Supports multiple cell cycles, debris and aggregate subtraction |
Synchronized cell cycle |
Analyze samples that have been synchronized (e.g. blocked in G0-G1 and then released). Supports one cell cycle, debris and aggregate subtraction |
Cell proliferation tracking |
For cells stained with cell-tracking dyes such as CFSE. Computes all cell proliferation statistics (e.g. Proliferation Index) |
Custom |
For an unrestricted analysis with a custom model |
Open Report Template
Enable this option to open the project's report template before each file in the batch is analyzed. This ensures that each file is analyzed with the same starting conditions.
When using a project, ModFit LT will open the project's report template when the project is opened. For most types of analysis, the report template does not need to be re-opened for each file analyzed and this option can be left unchecked. This would be true for most Cell Cycle, Synchronization, and Cell Tracking projects.
If you have a custom model for your project, you may want to enable this option.
Analysis
Choose what analysis option you want to occur when a new data file is opened. The options available are listed below:
No analysis: No analysis is performed.
Fit with current model: The Fit command is performed with the current model.
Auto Analyze: Automatic analysis is performed.
Auto Linearity
Enable this option to perform automatic linearity adjustment for each file.
Output
Save Report
Enable this option to save a report for each data file. The report is automatically named based on the name of the FCS file analyzed. Saving occurs after any analysis has been performed when moving to another batch item. Reports are saved in the Reports folder in the Output Path.
Save PDF
Enable this option to generate a PDF version of the report. PDFs are saved in the PDFs folder in the Output Path.
Save Report Graphic
This option saves a report graphic for each file analyzed. Graphics are automatically named based on the data file that is loaded, as described in Export Report Graphic. Graphics are saved in the Graphics folder in the Output Path.
Save Histogram Graphic
This option saves a histogram graphic for each file analyzed. Graphics are automatically named based on the data file that is loaded, as described in Export Histogram Graphic. Graphics are saved in the Graphics folder in the Output Path.
Save To
Output can be saved to the Project Output Folder or to a Specified Output Path. When Specified Output Path is selected, the Output Path field is used to select the output location.
Output Path
If the Save To option is set to Specified Output Path, reports will be saved to the path selected here. Click the Folder button to select a new location for output.
Printing
Print Report
Enable this option to automatically print a report to the current printer. Printing occurs when moving to another batch item.