Here is an example of a cell-tracking study that helps to explain the results that the Cell Tracking Wizard displays.
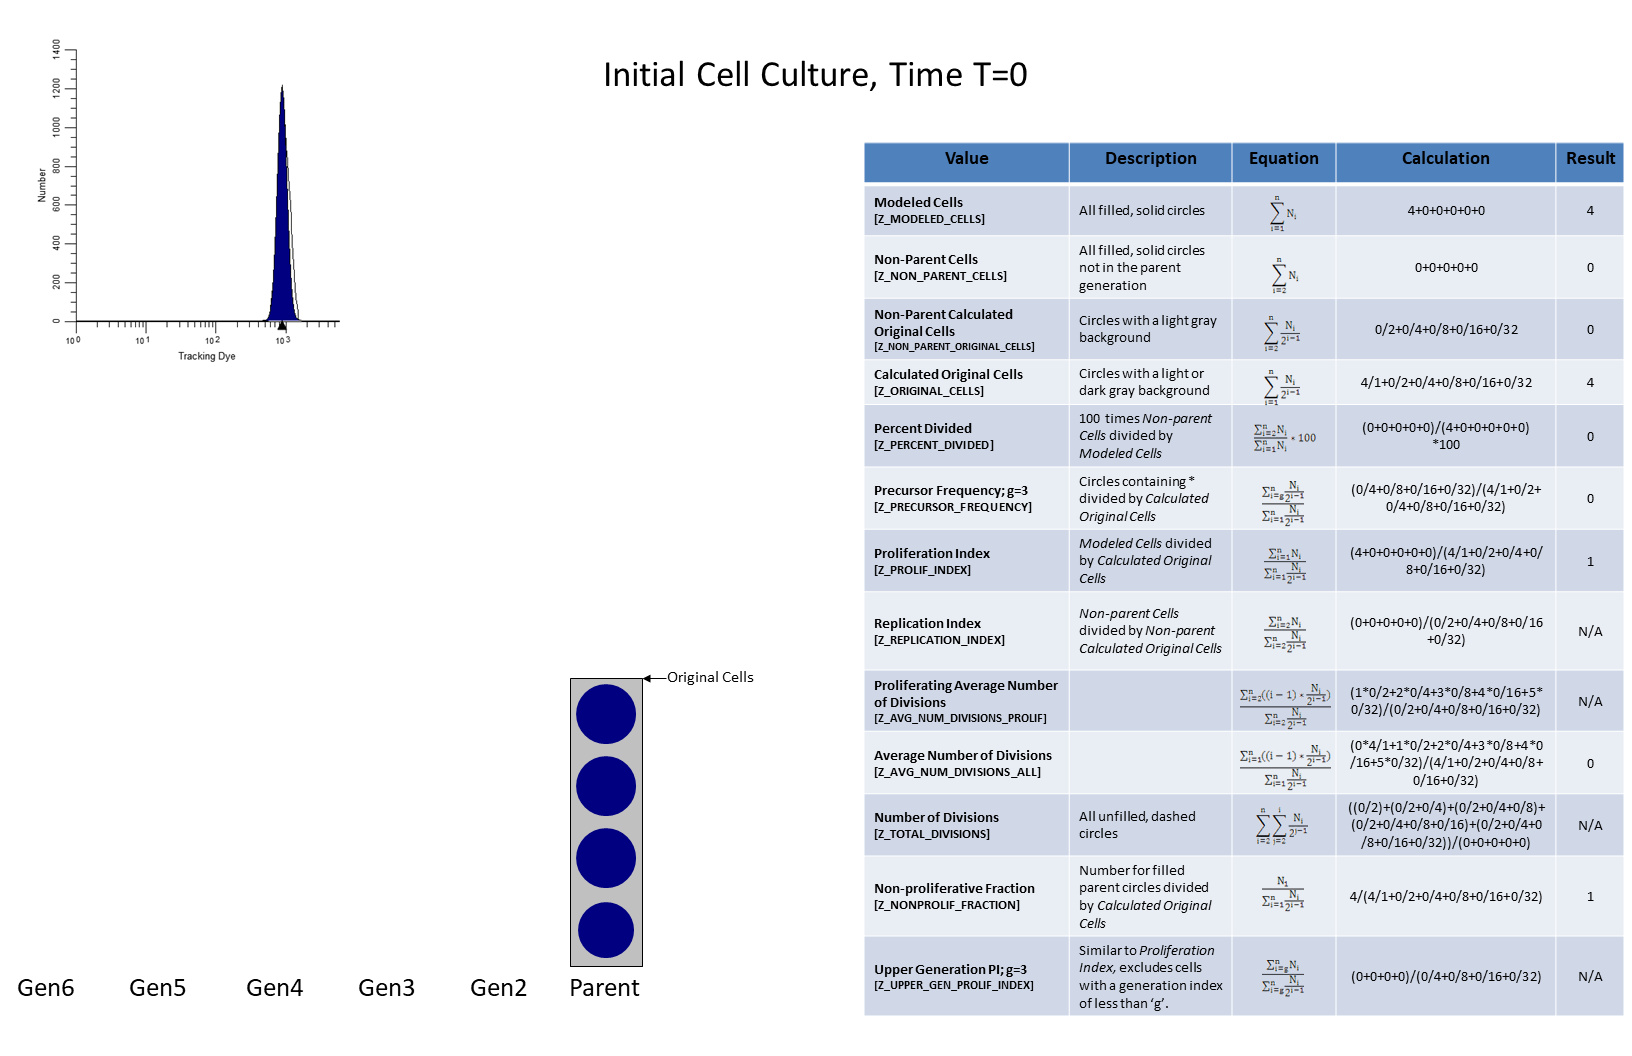
Suppose that we take samples at three time points: T=0, T=3h, and T=6h. For this simple cell tracking example, we will start at time T=0 with four cells stained for cell tracking.
For the population of cells at T=0, here's what we might see, and some example calculations for cell tracking equations.
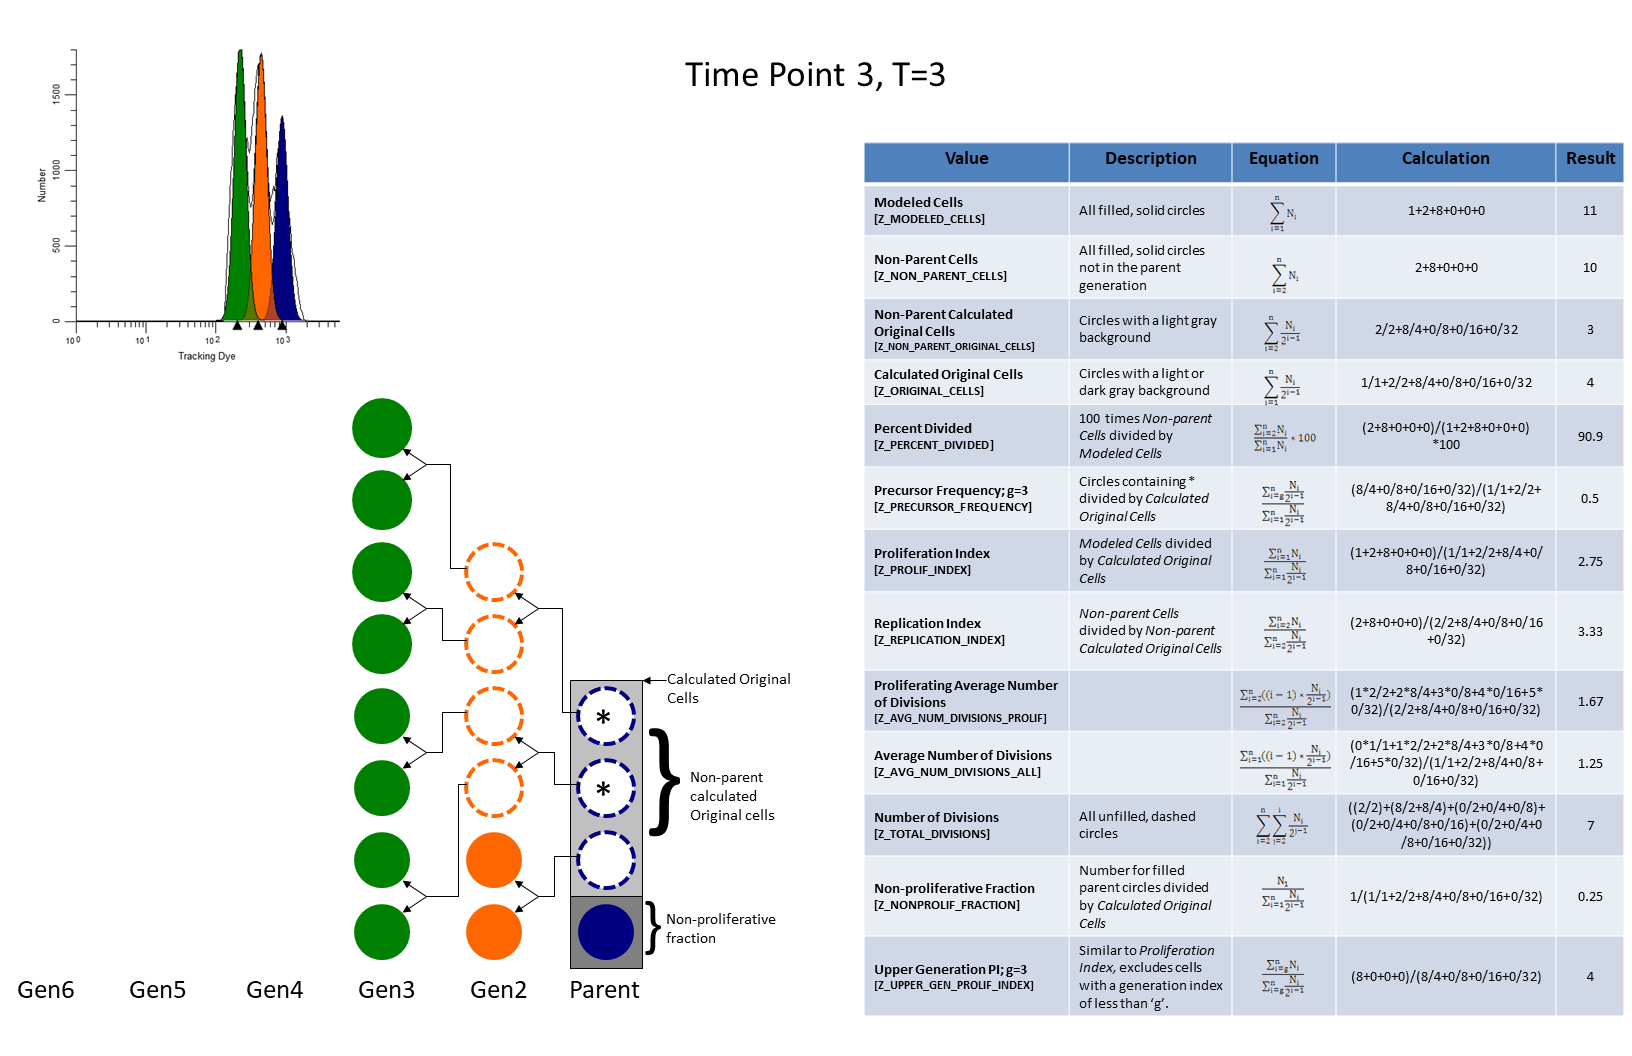
We can now look at the sample at time T=3 and compute the same equations on the current population of cells. Note that the filled in circles above represent cells that currently exist and the unfilled, dashed circles are cells that have divided into two daughter cells.
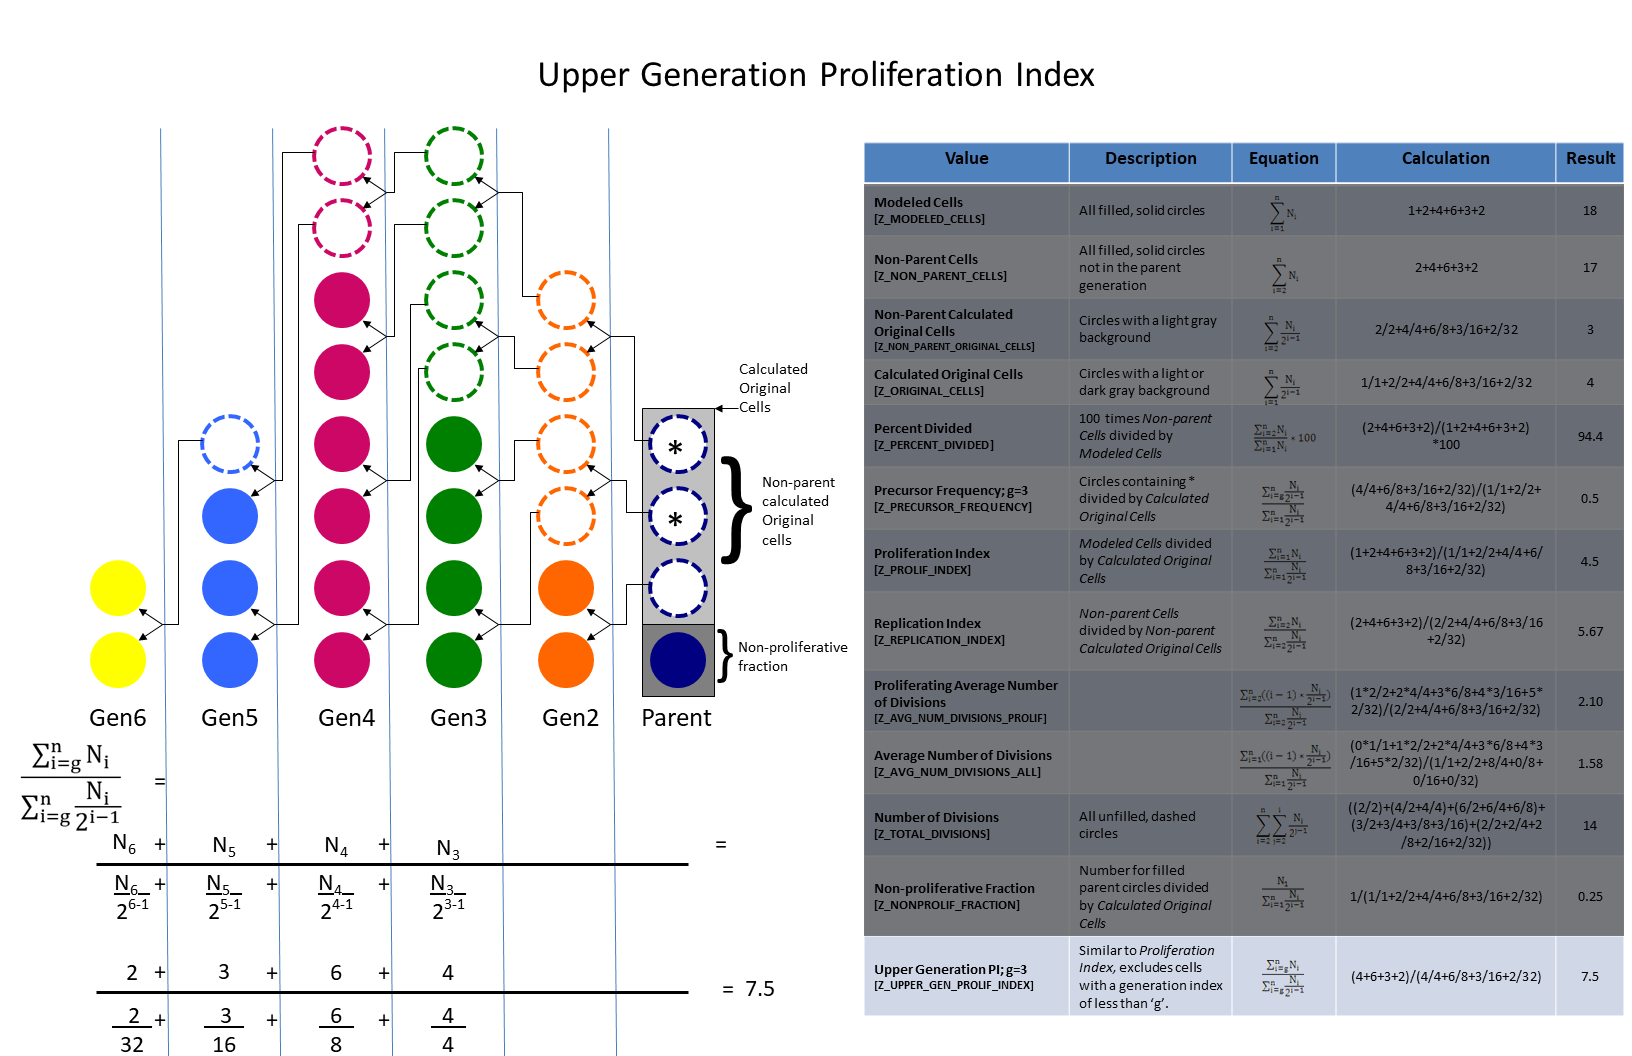
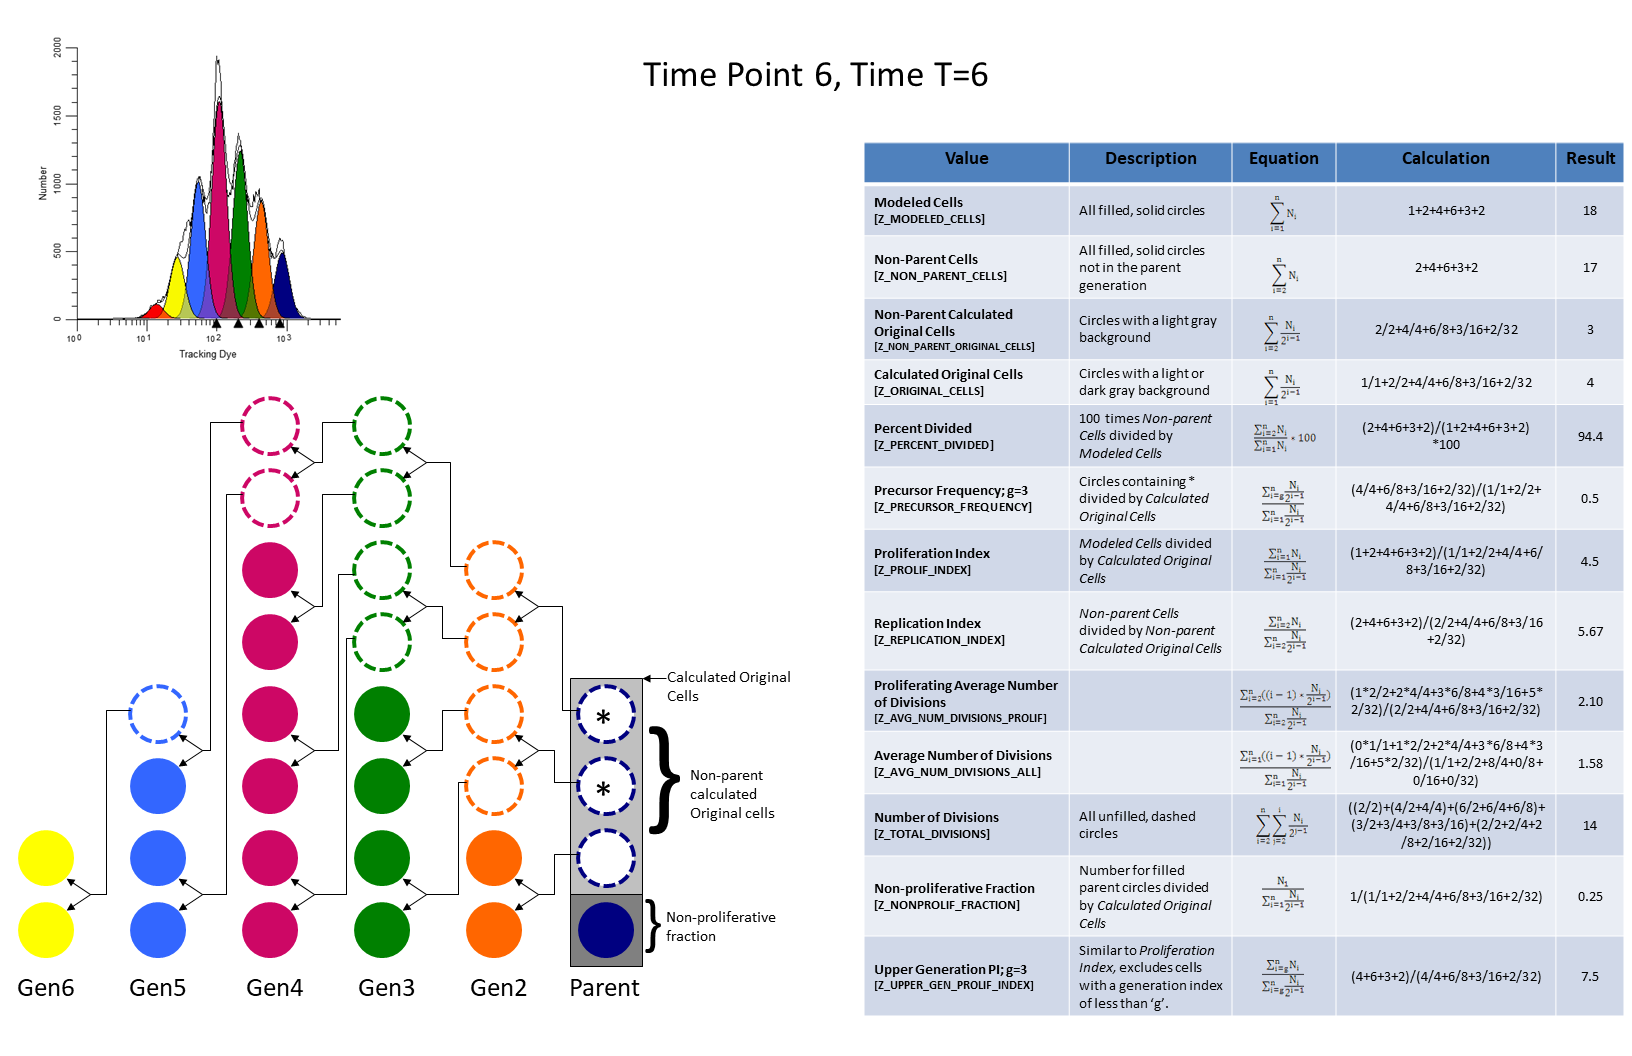
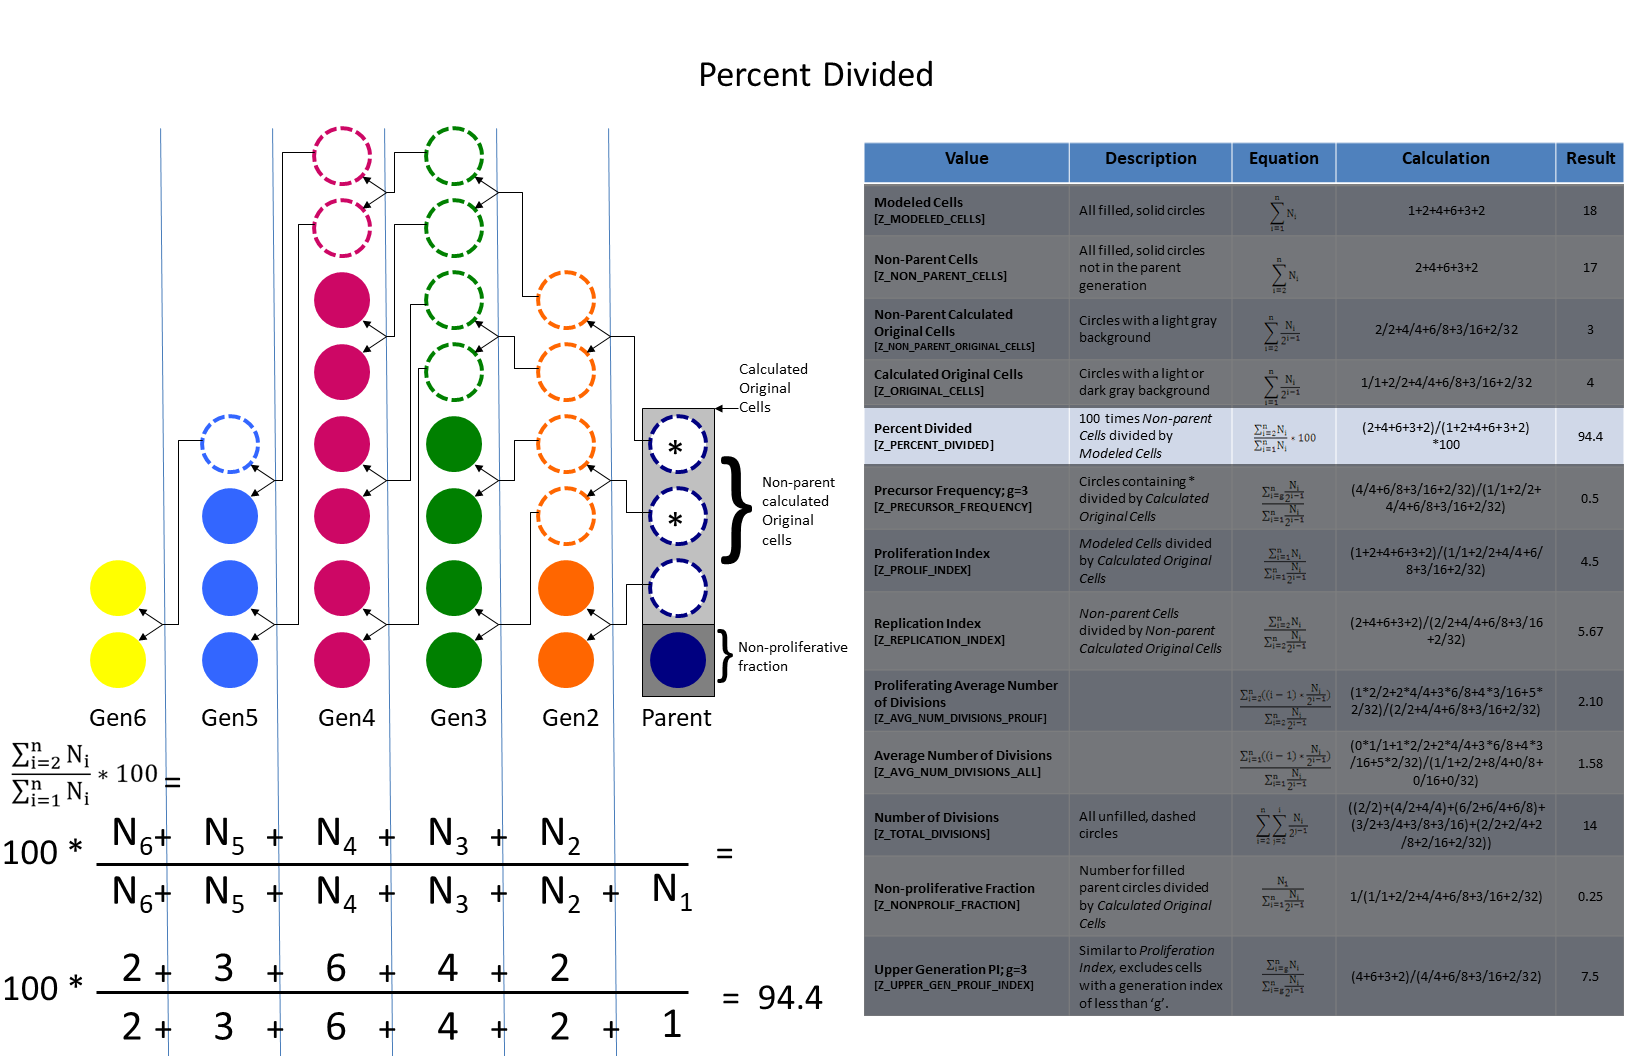
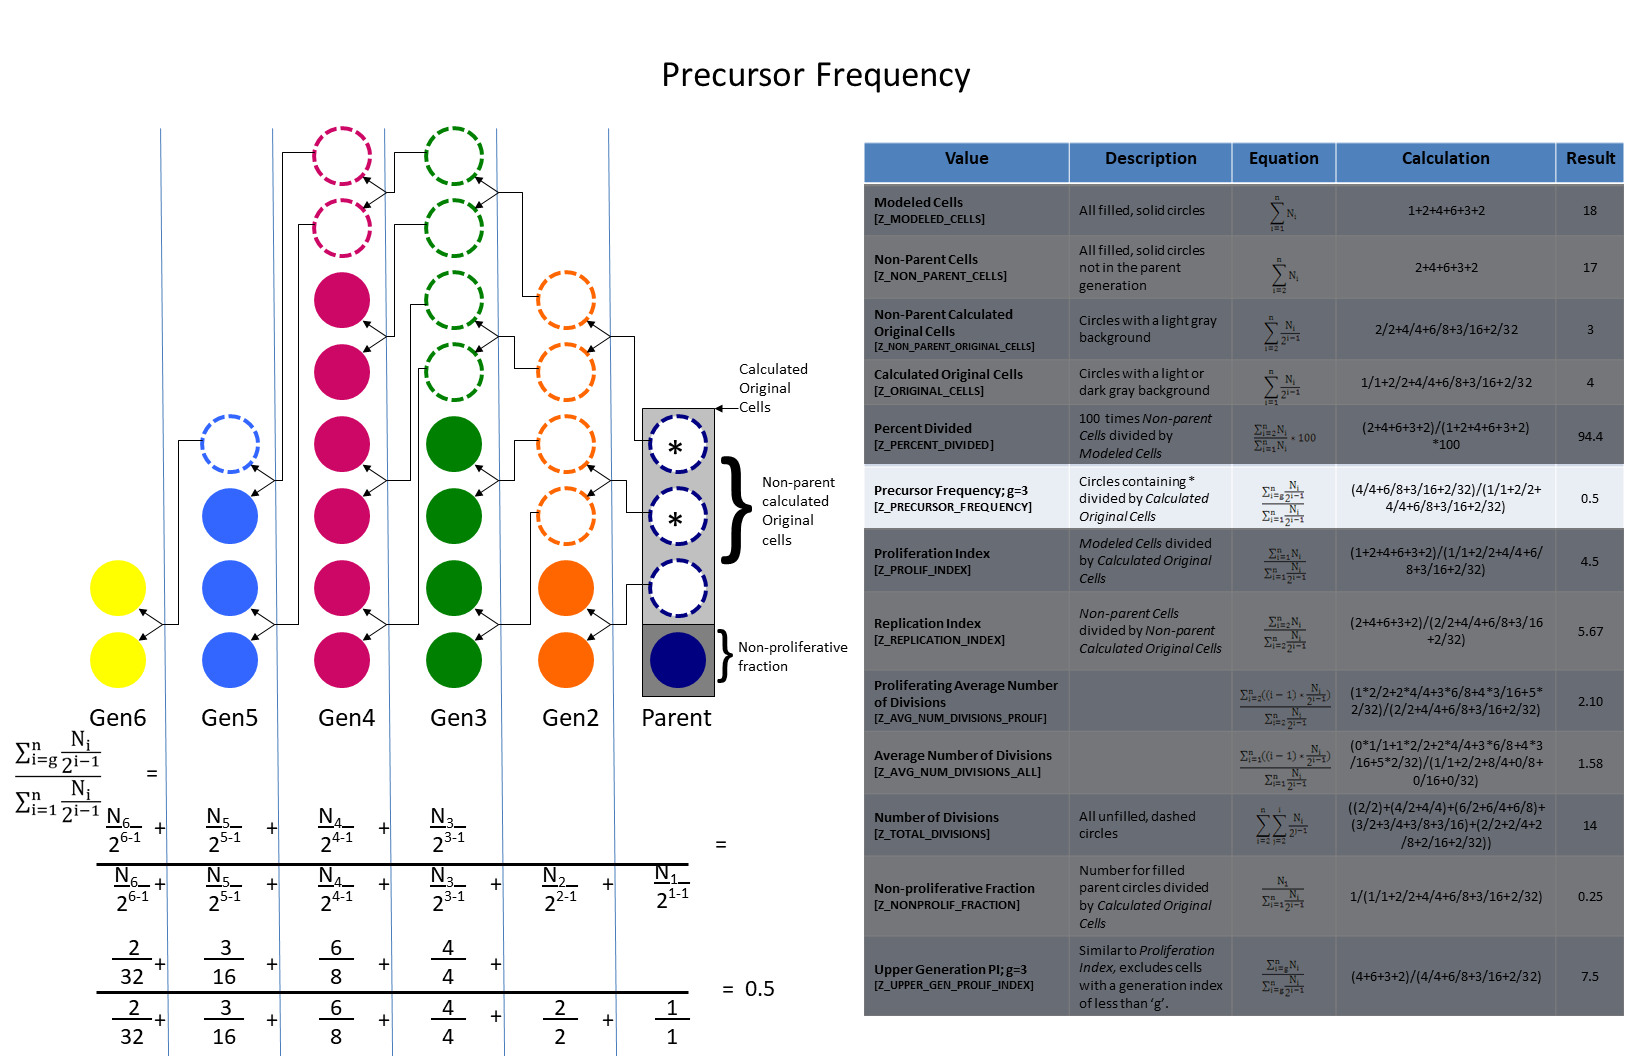
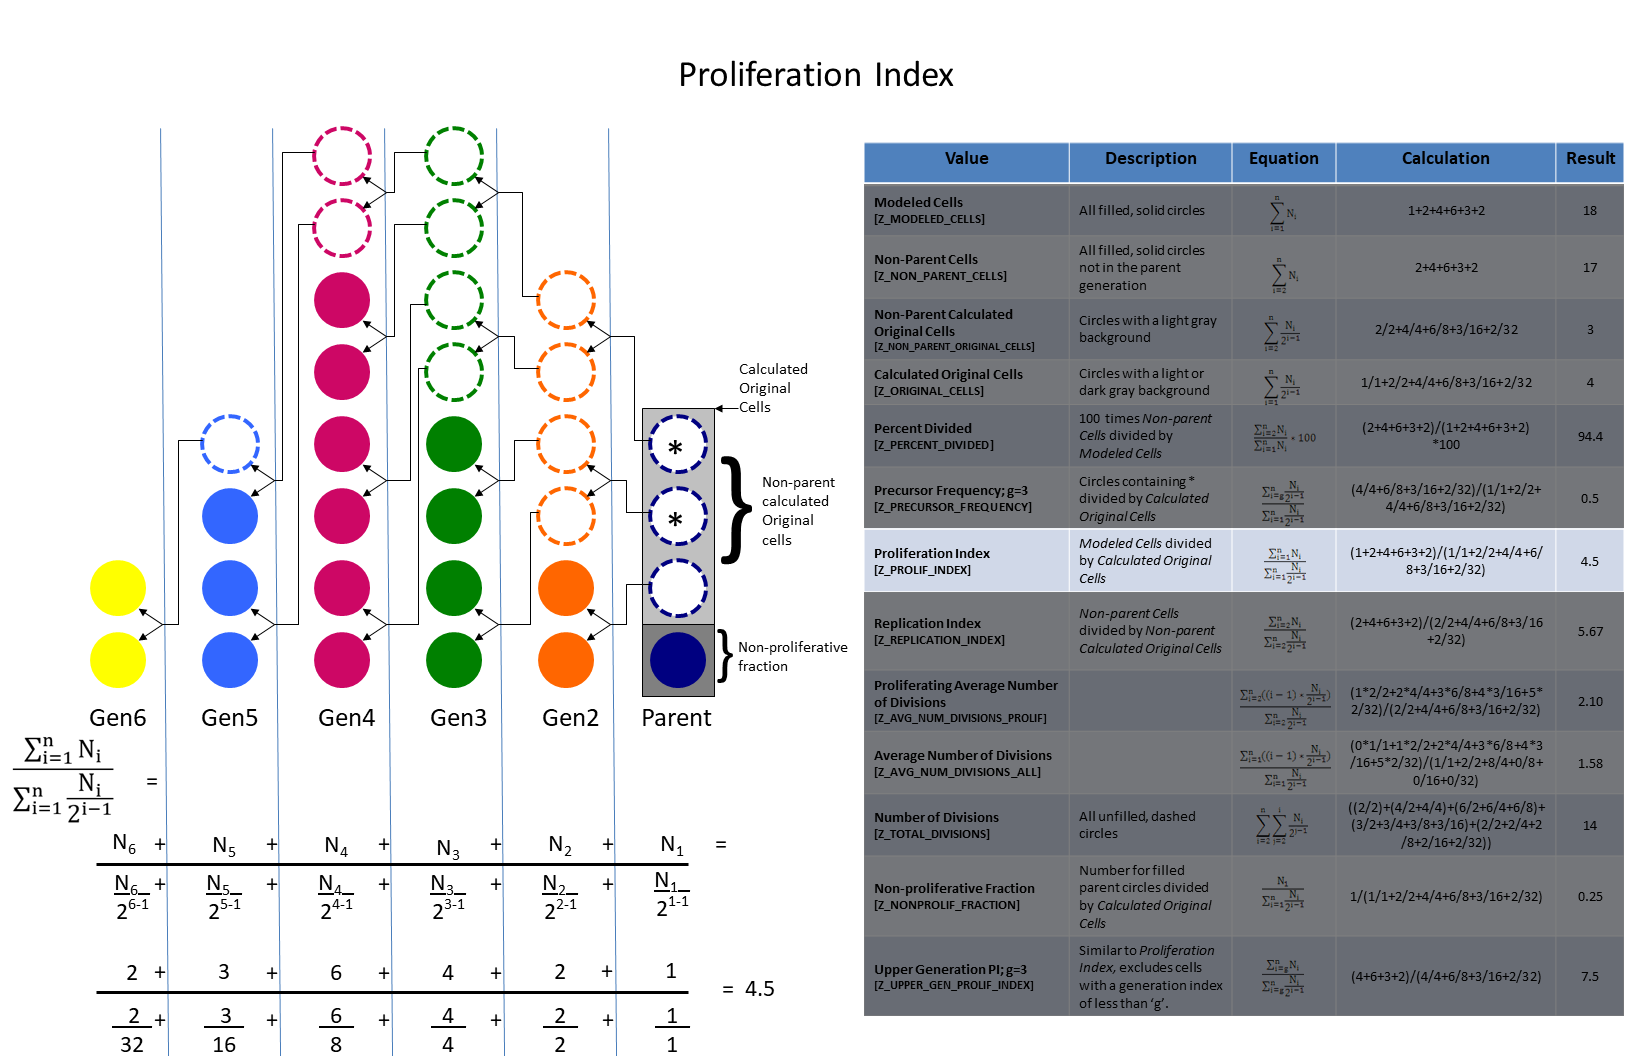
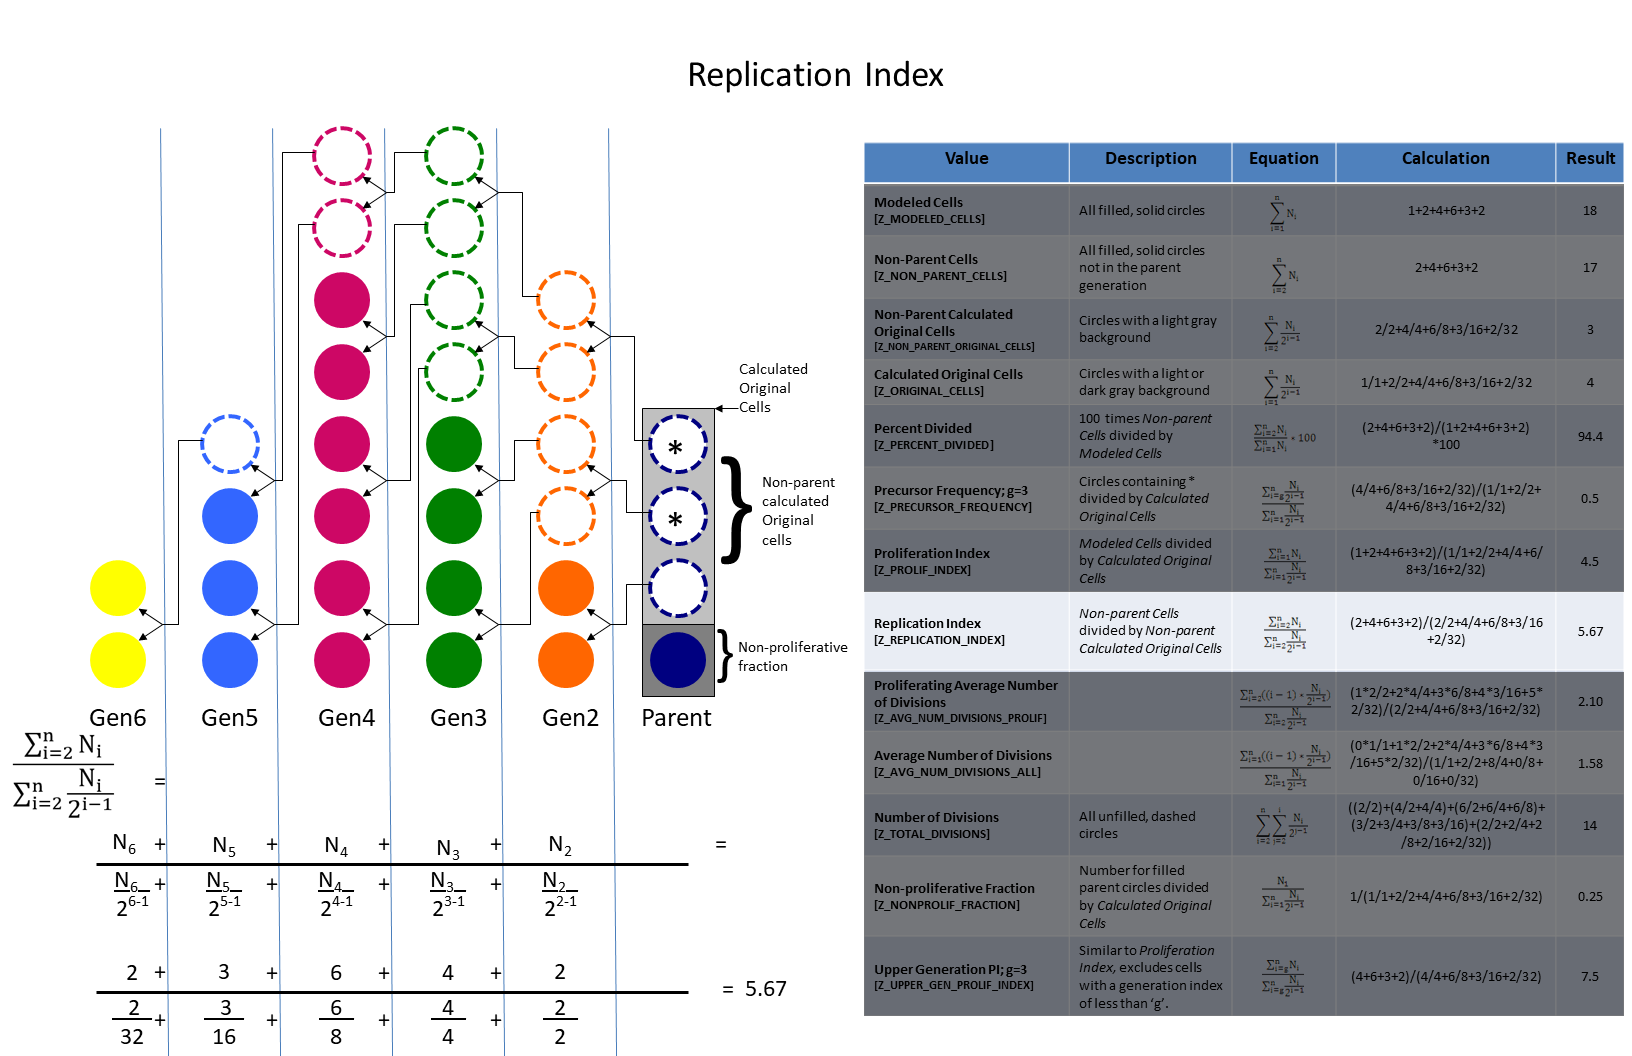
* Note, the circles containing an asterisk are those that went on to “true” proliferation. True proliferation is defined by g, the index of the user defined generation where true proliferation began. In this example, “true” proliferation begins at generation 3. Cells that remain in the parent or generation 2 did not truly proliferate.
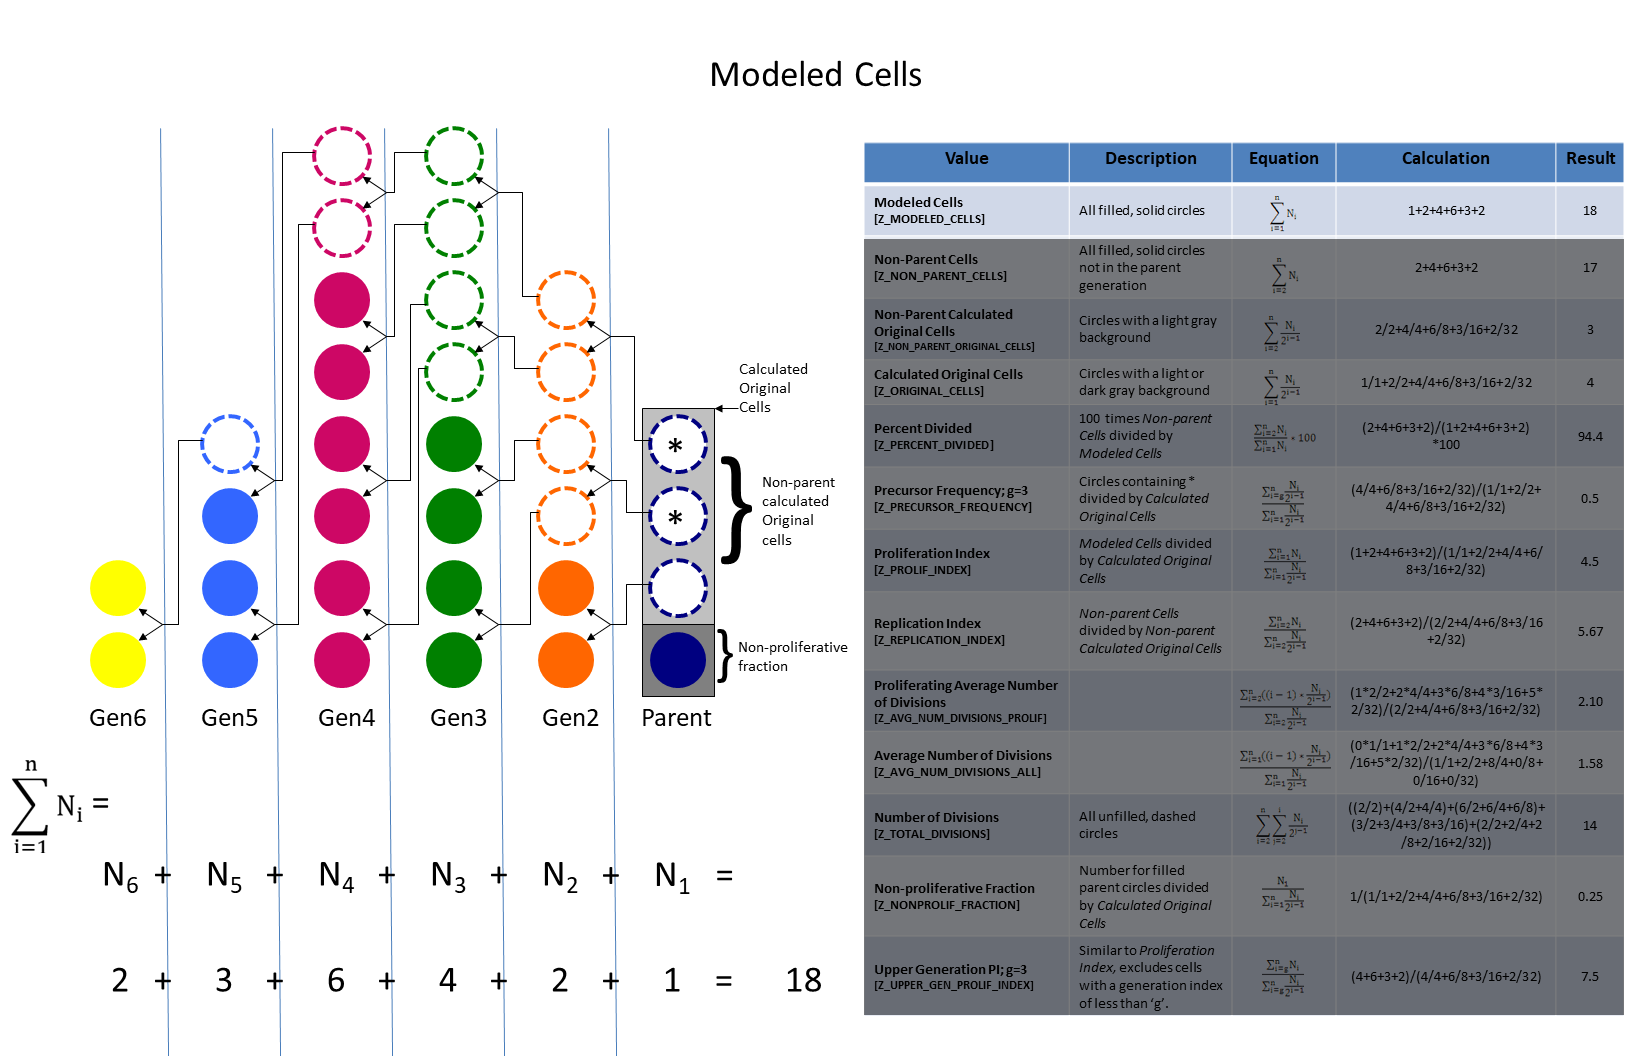
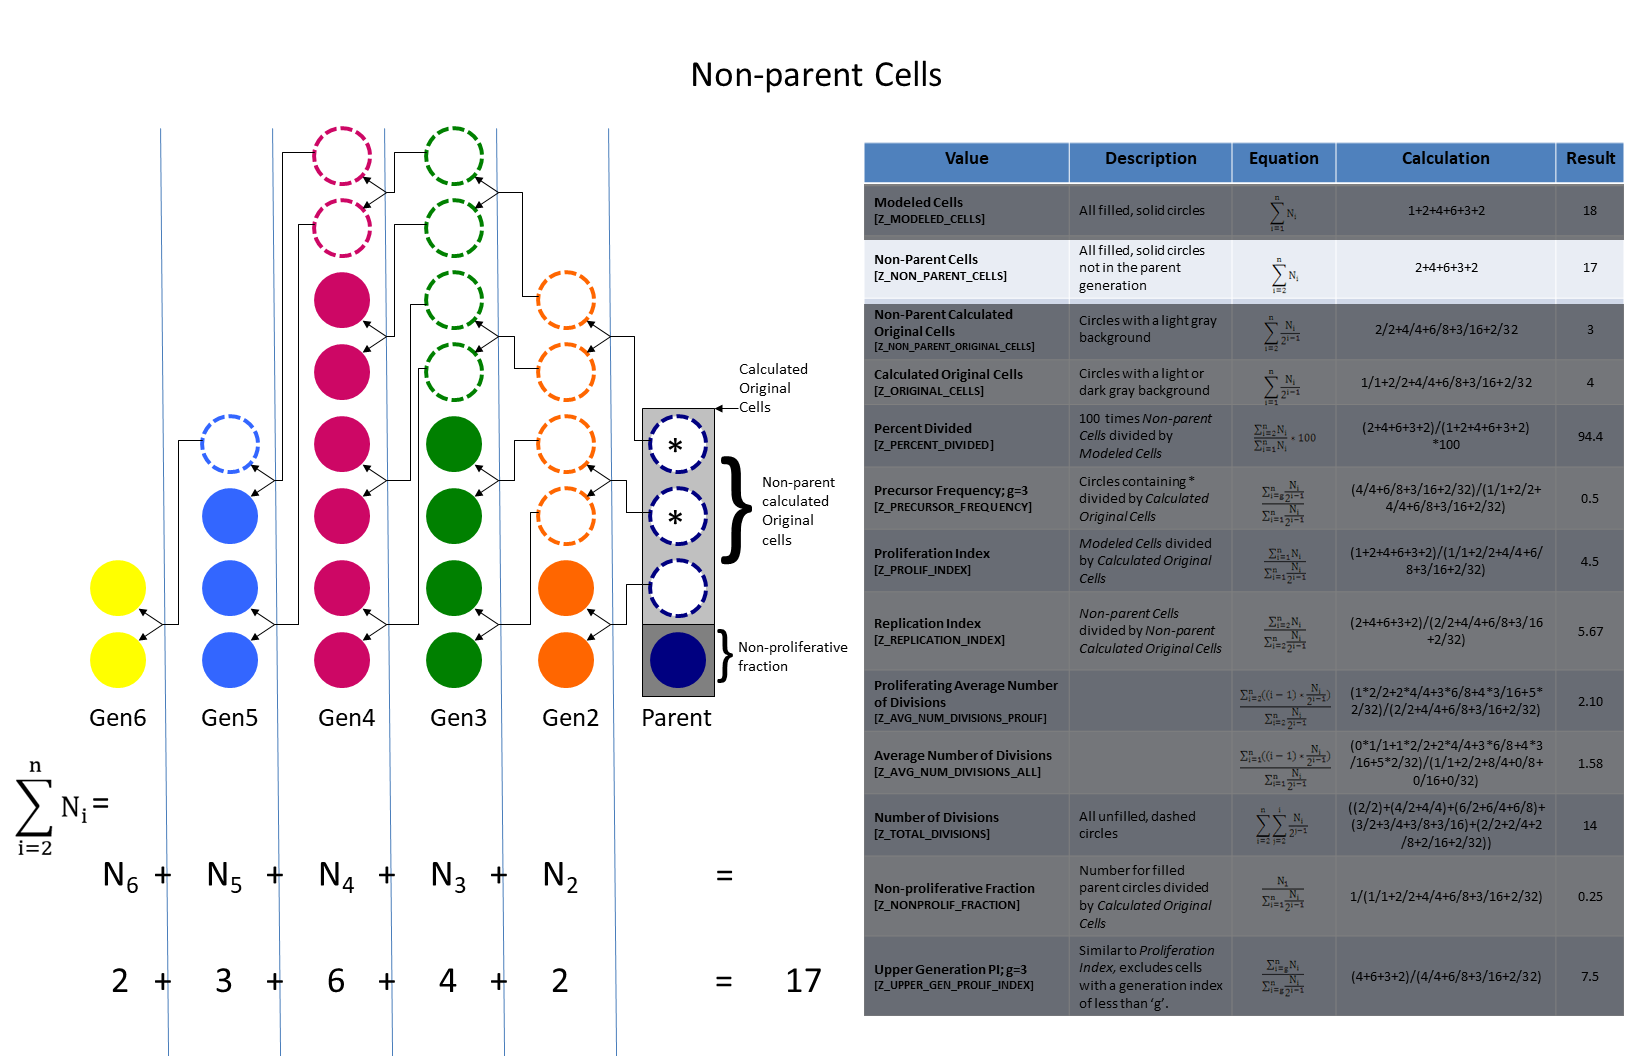
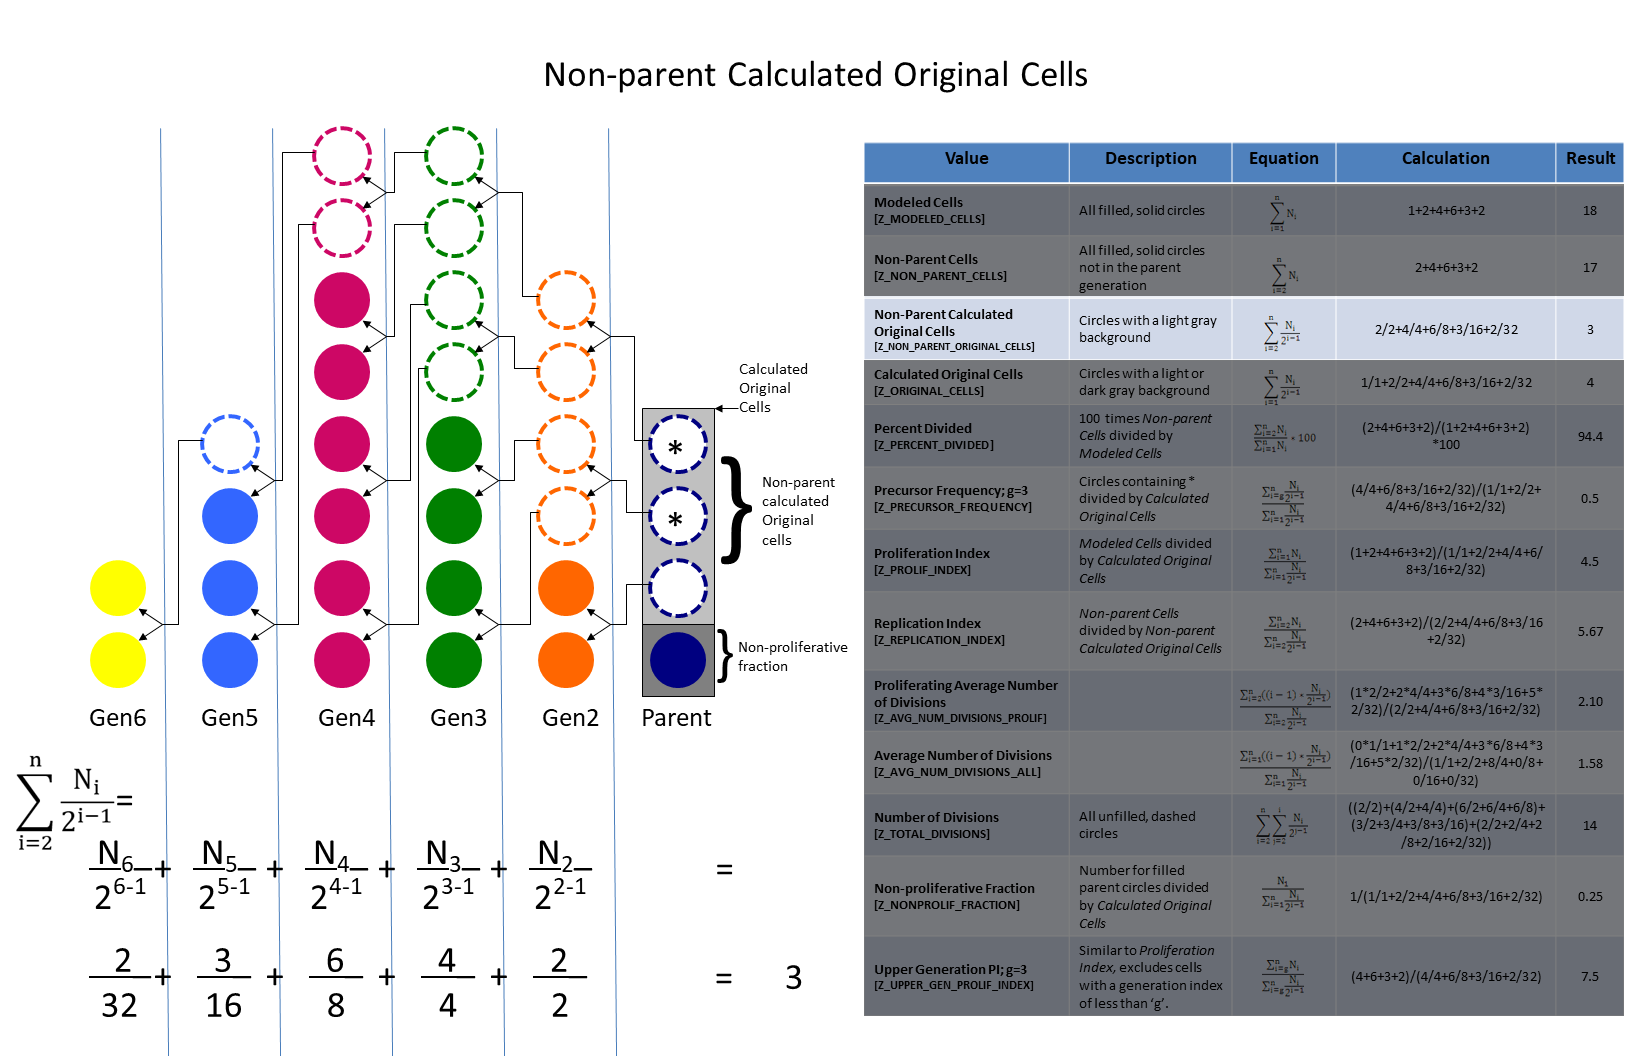
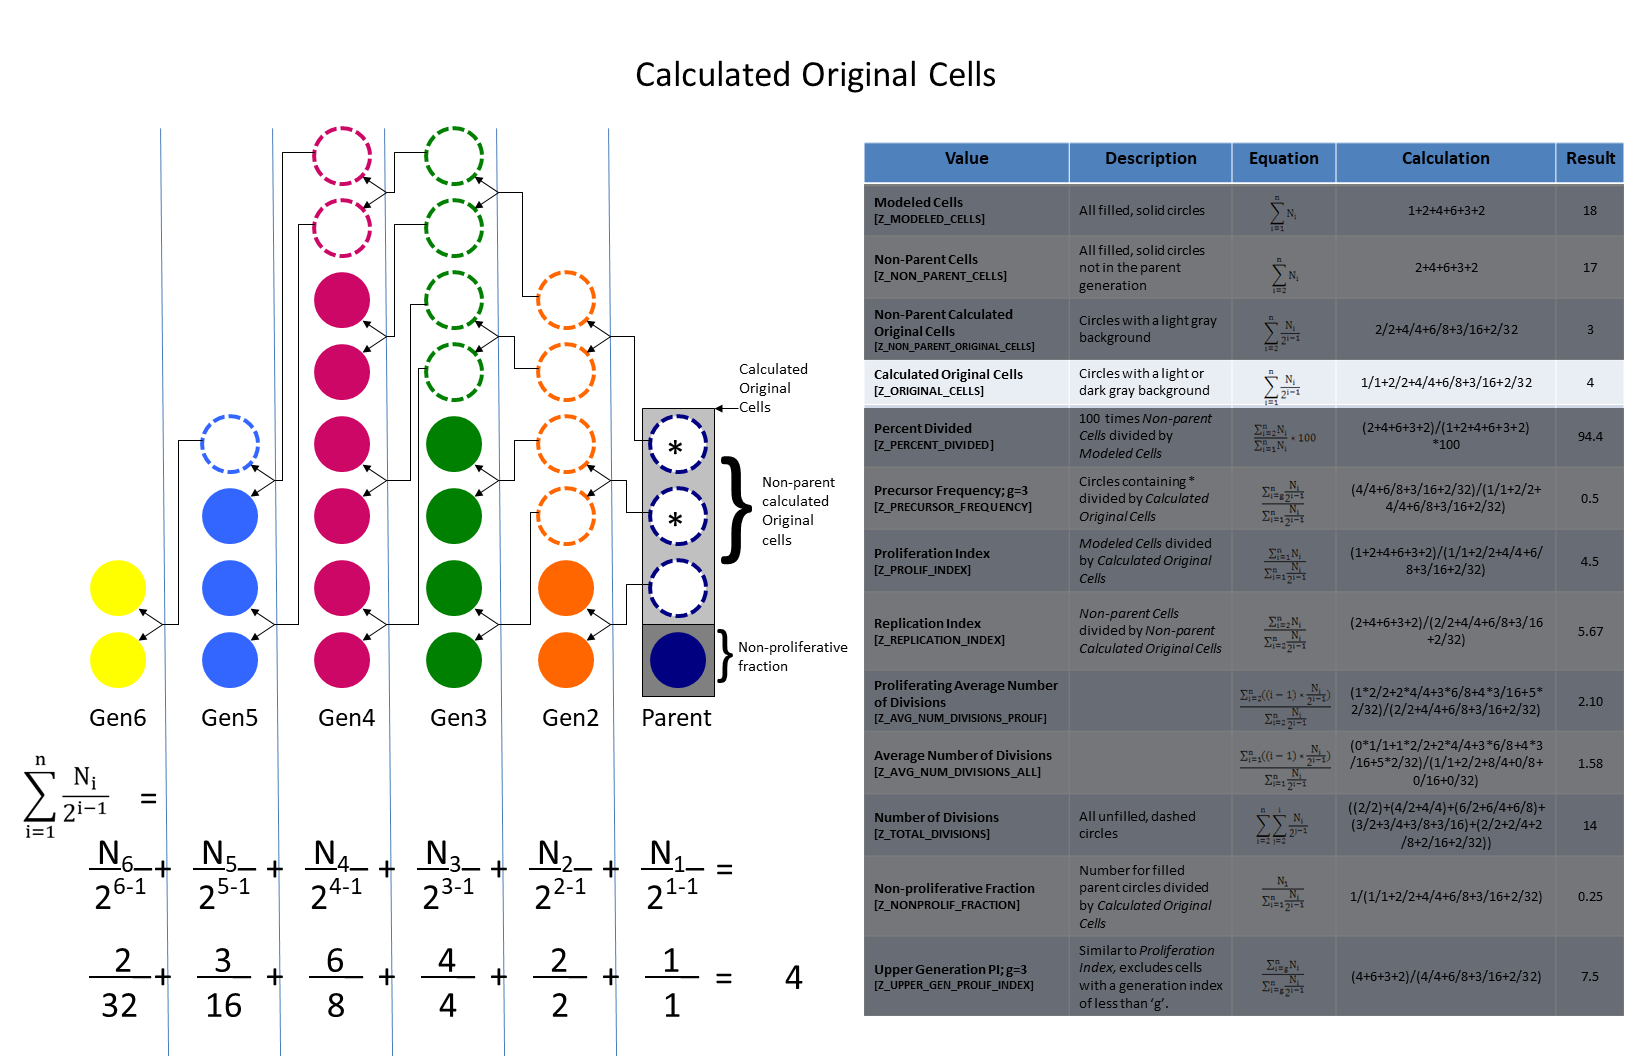
Here is our final time point T=6. Note that the filled in circles above represent cells that currently exist and the unfilled, dashed circles are cells that have divided into two daughter cells.
The number of Modeled Cells is dependent on the number of cells in the original culture and the amount of cell division. The number of modeled cells will increase with proliferation. This value is used mostly for computing other cell tracking statistics.
Non-parent Cells are modeled cells not in the parent generation. The number of Non-parent cells will be zero in the initial culture and will increase with proliferation. This value will always be less than Modeled Cells. This value is used mostly for computing other cell tracking statistics.
Non-parent Calculated Original Cells are the cells in the original culture that divided and gave rise to the modeled Non-parent Cells. The number of Non-parent Calculated Original Cells will be zero in the initial culture and will always be less than the Calculated Original Cells. This value is used mostly for computing other cell tracking statistics.
Calculated Original Cells are the cells in the original culture, both those that divided and those that did not. The number of Calculated Original Cells will be the same as Modeled Cells in the initial culture. This value is used mostly for computing other cell tracking statistics.
Percent Divided is the percent of cells in the final culture that divided at least once. The Percent Divided will be zero in the initial culture and will increase to at most 100%.
Precursor Frequency is the number of cells in the original culture that divided at least enough to get to the specified generation of “true” proliferation. In this example the specified generation is three. The Precursor Frequency will be zero in the initial culture and will increase with “true” proliferation to a maximum of 1.0.
Proliferation Index is the number of modeled cells divided by the cells in the original culture. This is the average number of cells that one original cell became. The Proliferation Index will be one in the initial culture and will increase with proliferation to a maximum of 2^(maxGen-1), where maxGen is the highest generation modeled.
Replication Index is the number of daughter cells divided by the number of cells in the original culture that divided. The Replication Index will be undefined (0/0) in the initial culture and will increase with proliferation to a maximum of 2^(maxGen-1), where maxGen is the highest generation modeled.
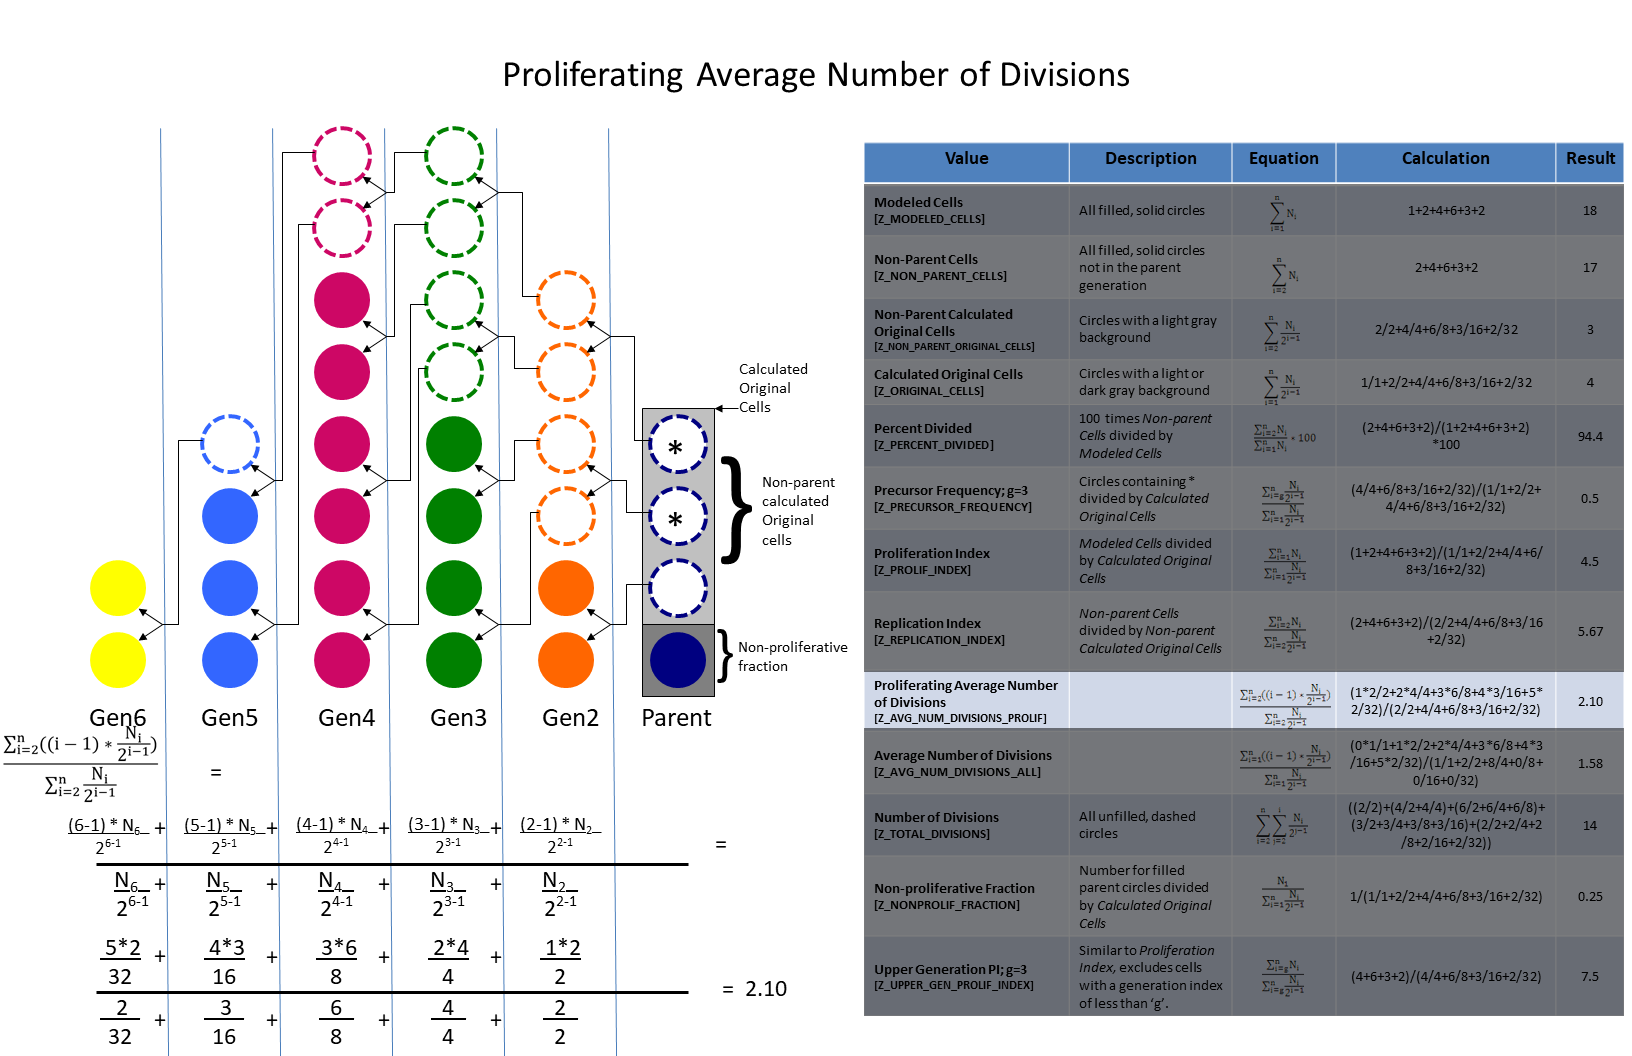
Proliferating Average Number of Divisions is the sum of the number of divisions that resulted in the cells in each generation divided by the Non-parent Calculated Original Cells. The Proliferating Average Number of Divisions will be undefined in the initial culture and will increase with proliferation to a maximum of maxGen-1 where maxGen is the highest generation modeled.
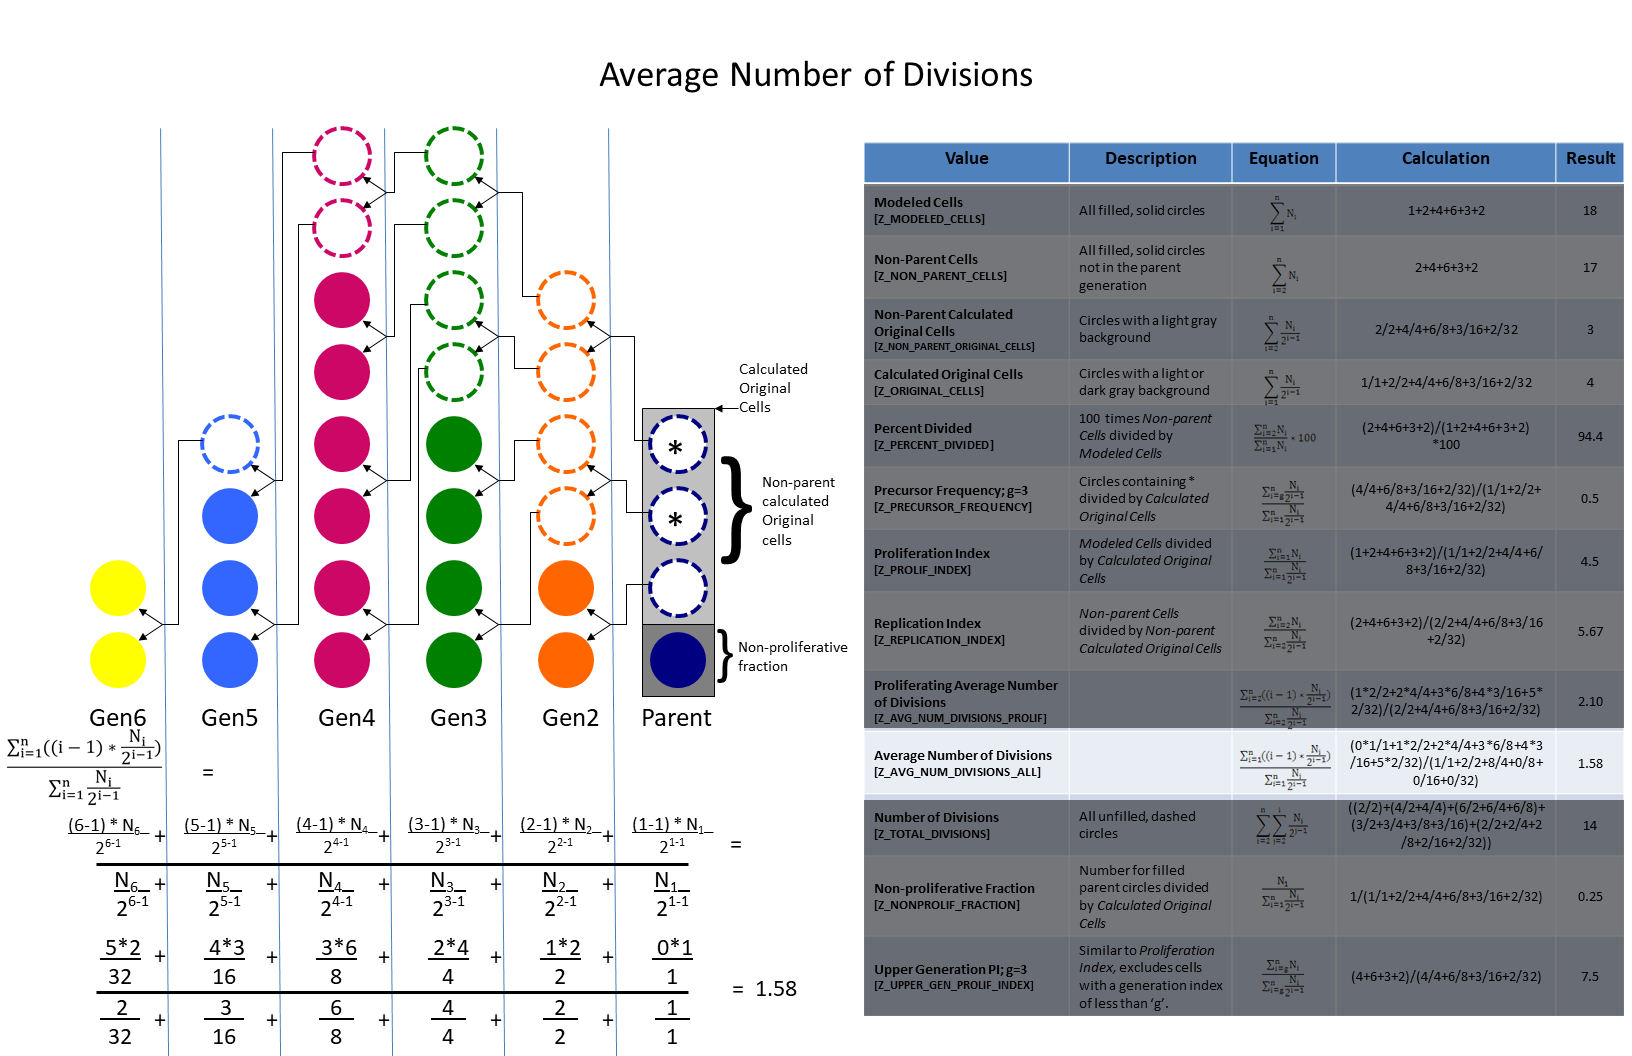
Average Number of Divisions is the sum of the number of divisions that resulted in the cells in each generation divided by the Calculated Original Cells. The Average Number of Divisions will be zero in the initial culture and will increase with proliferation to a maximum of maxGen-1 where maxGen is the highest generation modeled.
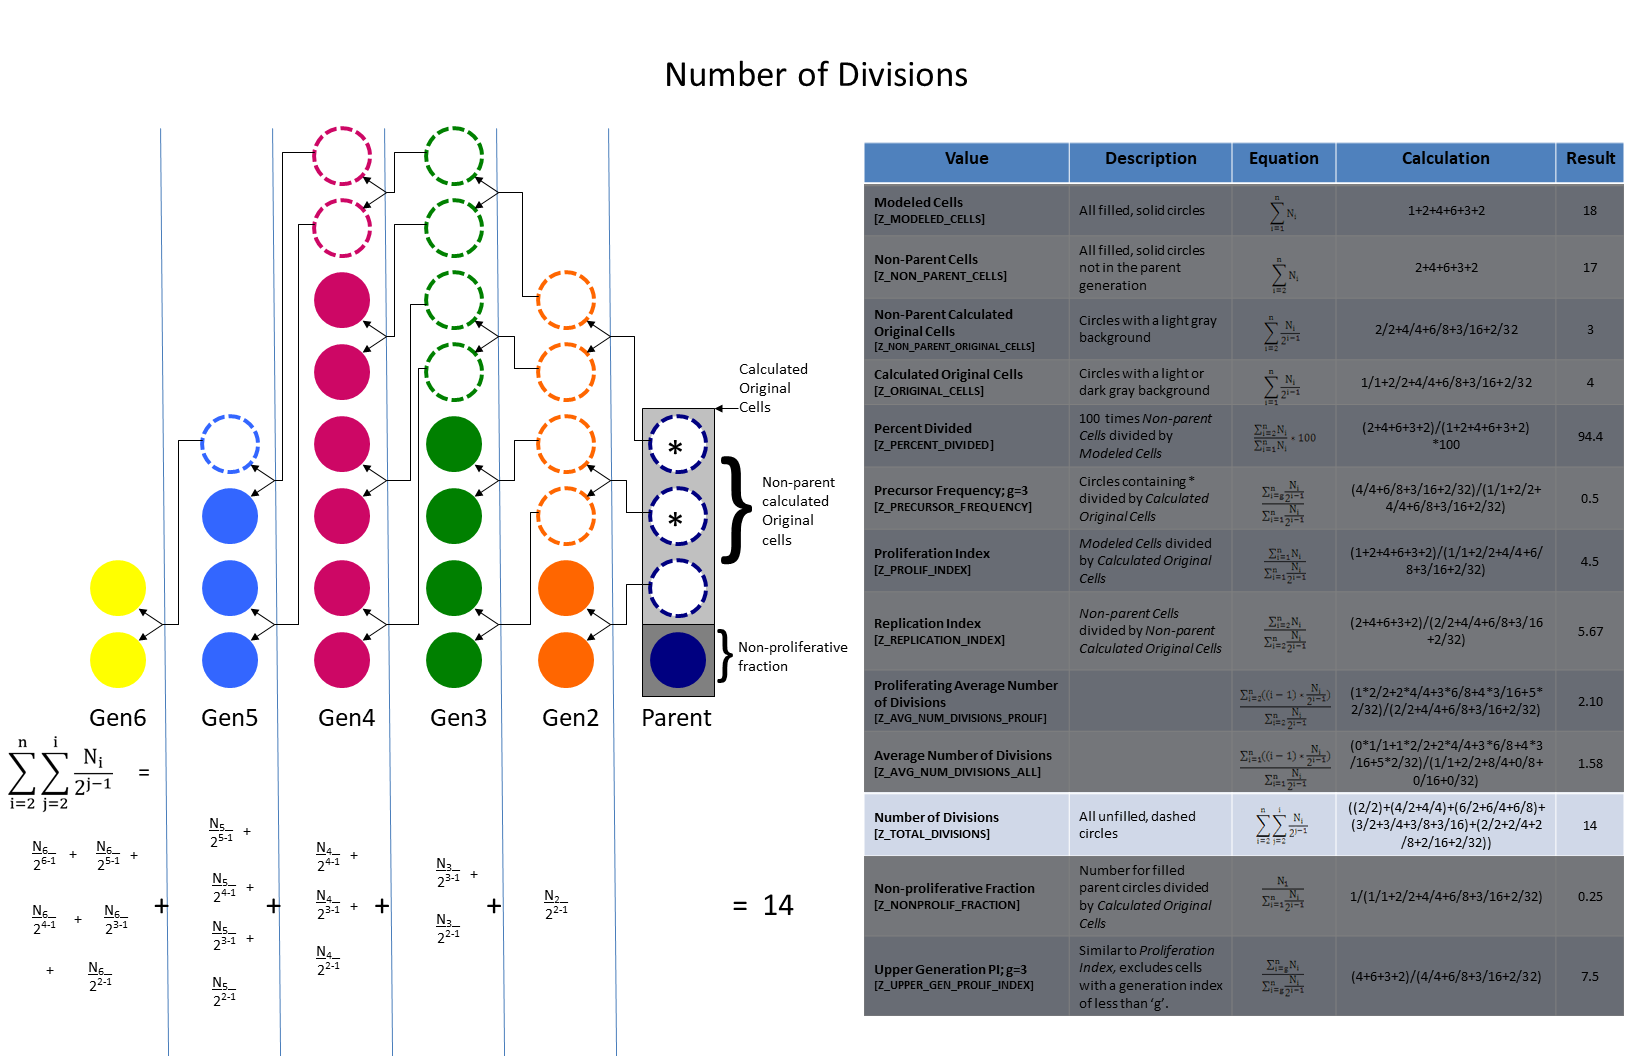
Number of Divisions is the total number of divisions that resulted in the cells in each generation. The Number of Divisions will be zero in the initial culture and will increase with proliferation.
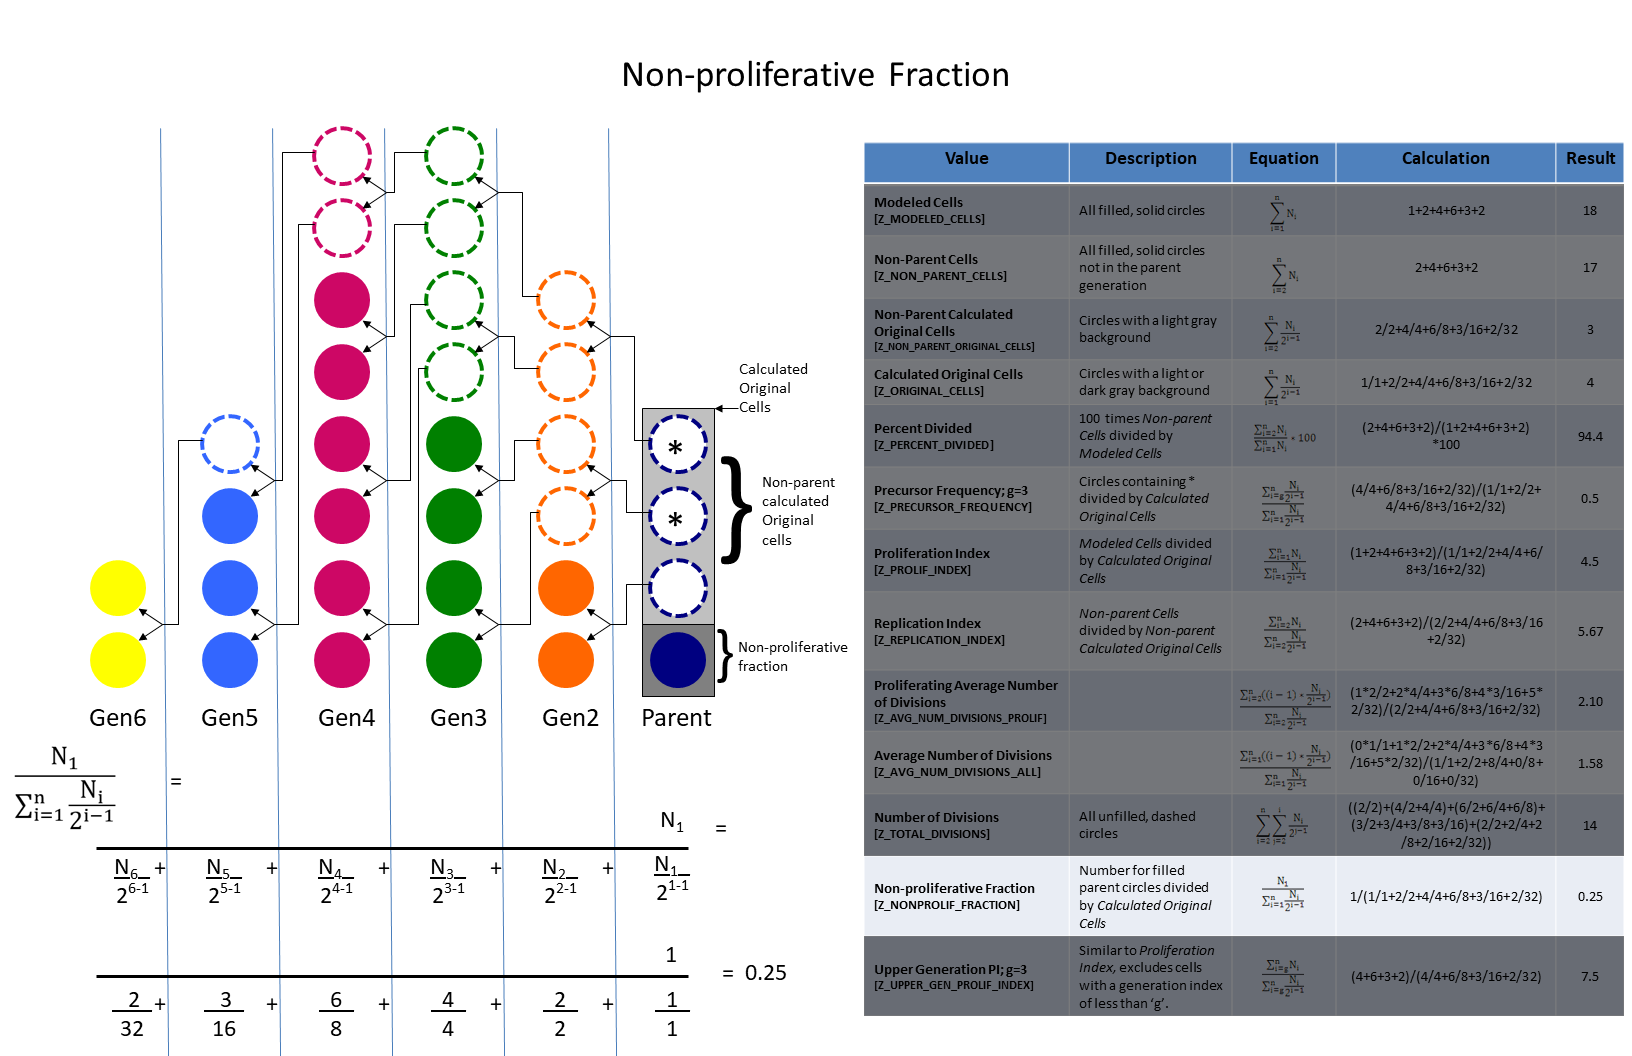
Non-proliferative Fraction is the number of modeled cells divided by the cells in the original culture. The Non-proliferative Fraction will be one in the initial culture and will decrease with proliferation to a minimum of zero.
Upper Generation Proliferation Index is the number of modeled cells divided by the cells in the original culture for generations greater than g, which is 3 in this example. This is the average number of cells that one original cell became, excluding those in generations less than g. The Upper Generation Proliferation Index will be undefined in the initial culture and will increase with proliferation to a maximum of 2^(maxGen-1), where maxGen is the highest generation modeled.