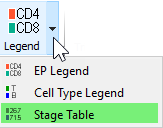

This tool allows you to create a stage statistics table on the report or cell types. It is found on the Insert tab of the ribbon, as well as the toolbar for the report and cell type.
Once the tool is selected, click and drag on the report or cell type to create the object. Double-click the object to edit its properties.
The stage table is associated with a selected cell type when it is created. The table shows the name, color, and other useful information about the stages for the selected cell type.

The Active column can be used to turn stages on and off quickly. When a stage is active, statistics are computed and stage-coloring is applied to dots. When inactive, a stage is ignored by the analysis routines.
The Color for the stage is displayed and can be edited by clicking the color swatch.
Several statistics are displayed for each stage:
| Percent | The percentage of events relative to this cell type that are contained by the stage. |
| %Total | The percentage of events relative to all cell types that are contained by the stage. |
| Events | The number of events contained by the stage. |
| Mean | When statistics are turned on, this shows the mean intensity value of the stage |
| SD | When statistics are turned on, this shows the standard deviation of the stage. |