This tool allows you to create a TriCOM on the report or cell types. It is found on the Insert tab of the ribbon, as well as the toolbar for the report and cell type.

Once the tool is selected, click and drag on the report or cell type to create the object. The TriCOM will be created with default properties and a default set of markers. Double-click the object to edit its properties and select which markers to use with the TriCOM.
Tools to manipulate the plot appear on the right edge of the plot window when the mouse is over the plot.

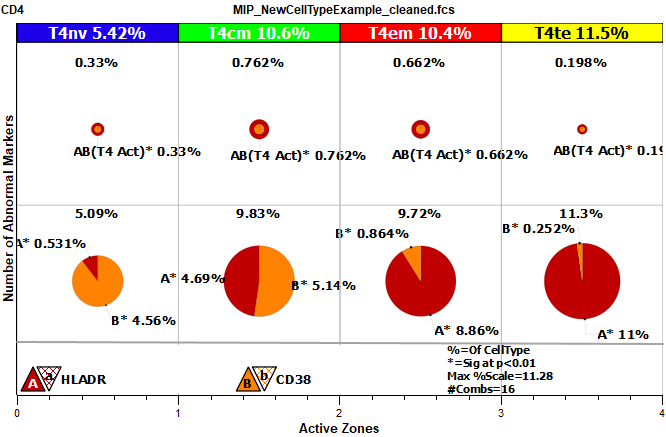
The bottom of the TriCOM shows a legend of the markers that are being used. In the example above, the markers are HLADR and CD38. A letter is assigned to each marker. A capital letter is shown with a solid color and represents the above-normal expression of the marker. A lower-case letter is shown with a hatched color and represents below-normal expression of the marker. In the example above, the letter A is assigned to HLADR and B is assigned to CD38.
If the TriCOM is created for a cell type that has stages defined, the TriCOM will have a column for each stage. In the example, there are 4 stages defined: T4nv, T4cm, T4em, and T4te.
The rows of a TriCOM contain pie charts of expression. The lowest row shows expression where only one of the markers is positive. The next row up shows 2 positive markers, and so on. In the example with two markers, there are two rows of expression pie charts: the first showing single-positive expression, and the second showing double-positives.
See the tutorial Working with TriCOM for additional explanation and examples.
Context menu
There are 2 context menus for TriCOM objects: the frame's context menu and the TriCOM plot context menu.
Frame context menu:
The context menu is displayed by right-clicking on the title area.
Copy
Copies the object to the clipboard.
Save Image
Saves the object as a graphic to disk.
Edit Frame
Displays the Edit Frame dialog.
Bring to Front
Brings the object to the front of other objects.
Send to Back
Sends the object behind other objects.
Delete
Deletes the object.
Flag to Save
Check this option to save the graphic after auto analysis.
TriCOM plot context menu:
The context menu is displayed by right-clicking on the title area.
Edit Graphics
This command displays the Graphic Options for TriCOM dialog, used to select measurements for the TriCOM and adjust its display properties.
Edit Segment
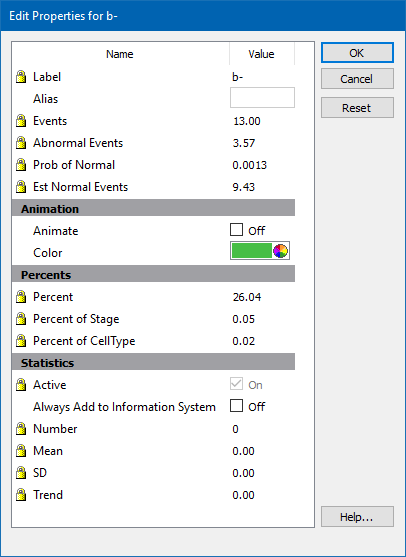
This command allows you to edit the properties of the segment of the selected pie chart.
Many properties are locked so that they cannot be edited. You can, however, edit the Alias, Animation, and several other properties of the segment with this dialog.

Edit All Segments
Edits all segments in all stages in the TriCOM. See the tutorial Working with TriCOM for additional explanation
Turn Off All Animations
Stops animations on all objects.