Moving to previous profile
Moving to next profile


This page is shown for each of the selection, staging, and functional markers selected in previous pages of the Cell Type wizard. It is used to choose and set up the expression profile for the marker in the cell type being created or edited.
When this page is displayed, move the wizard so that you can see the expression profiles in the cell type widget. This allows you to preview your choices.
When navigating through the profiles, you will use the Next
Profile button that appears on the right of the dialog and the
Previous Profile button that appears
on the left. If one is disabled, that indicates you've reached the
beginning or end of the list of profiles.
Moving to previous profile |
Moving to next profile |
 |
 |
Selection Profiles
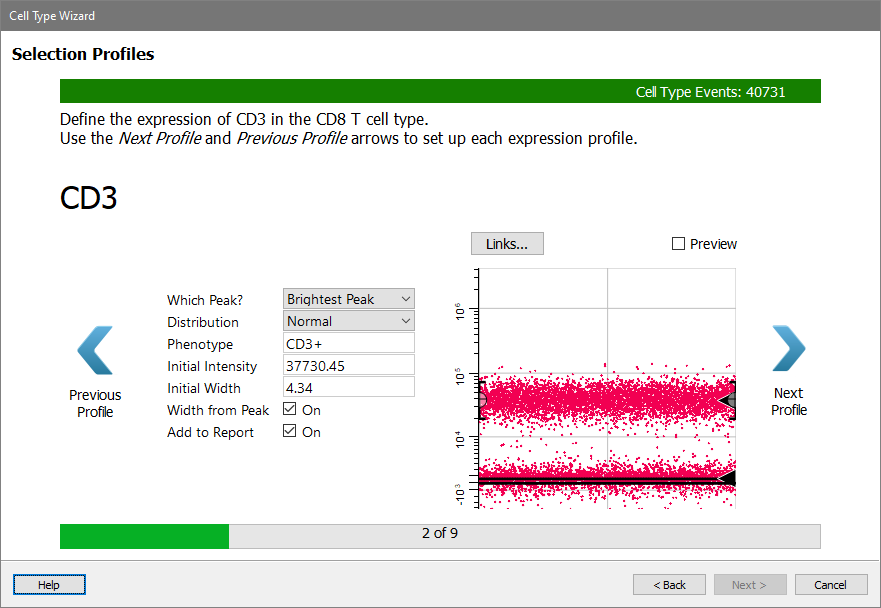
Constant profiles are used for selection markers.

The Links button allows this profile to be linked to another profile. For example, it is common to link the CD3+ profile for CD4 cell type to the CD3+ profile of the CD8 cell type.
The Preview checkbox shows the profile in its unmodelled (unchecked) or modelled (checked) state.
The properties for selection profiles are listed below.
Which Peak?
Choose which peak in the marker the expression profile should track.
| User estimate | The marker doesn't use a peak. It uses the estimates for Intensity and SD to position and size the profile. |
| Closest | Find the closest peak to the starting location of the profile and use its peak estimates. |
| Dimmest | Find the dimmest peak (lowest intensity) and use its peak estimates. |
| Brightest | Find the brightest peak (highest intensity) and use its peak estimates. |
| Smallest | Find the smallest peak (lowest number of events) and use its peak estimates. |
| Largest | Find the largest peak (largest number of events) and use its peak estimates. |
Distribution
Choose the type of distribution to use for this profile.
| Normal Distribution | The control definition points define the mean of a normal distribution. |
| Inverse Normal | The profile is the inverse the Normal Distribution. |
| Inverse Low Pass | The profile is the inverse of the Low Pass distribution. |
| Low Pass | The control definition points define a probability "edge". Events below the CDPs are included. |
| High Pass | The control definition points define a probability "edge". Events above the CDPs are included. |
| Inverse High Pass | The profile is the inverse of the High Pass distribution. |
Phenotype
This field is automatically filled in when possible. Enter a short phenotype description for the selection. This is used on report pages.
Initial Intensity
This intensity estimate can be edited when the Which Peak value is set to User Estimate or Closest.
Initial Width
This intensity estimate can be edited when the Which Peak value is set to User Estimate or Closest.
Width from Peak
If this option is enabled, the program will adjust the profile's width based on the peak estimates.
Add to Report
If this option is enabled, a graph of the measurement will be included in on the report page.
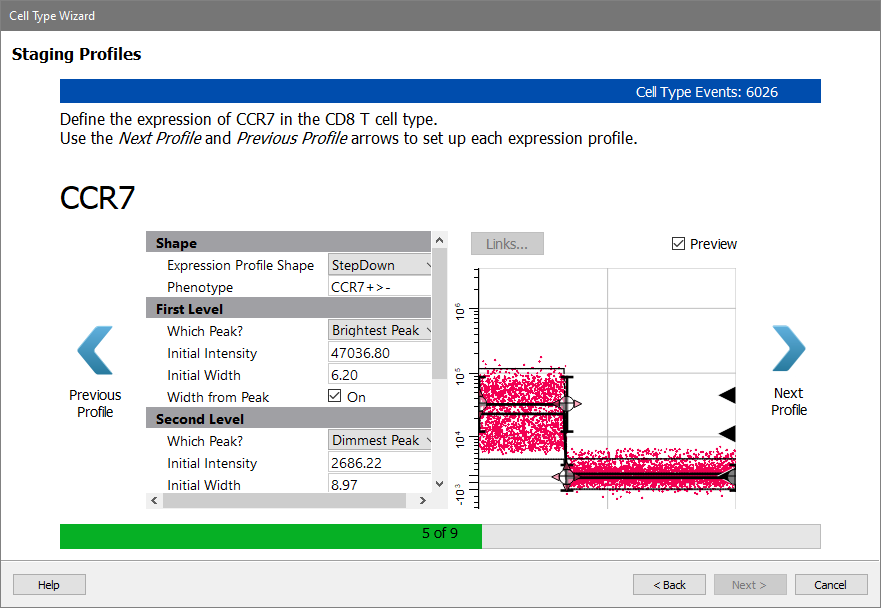
Staging Profiles
Staging profiles can be StepUp, StepDown, or ThreeLevels. Choose the one that best matches the change in expression for that marker in the cell type being edited.

The properties of the staging profile are the same as for Selection, except they are repeated for each level of the profile.
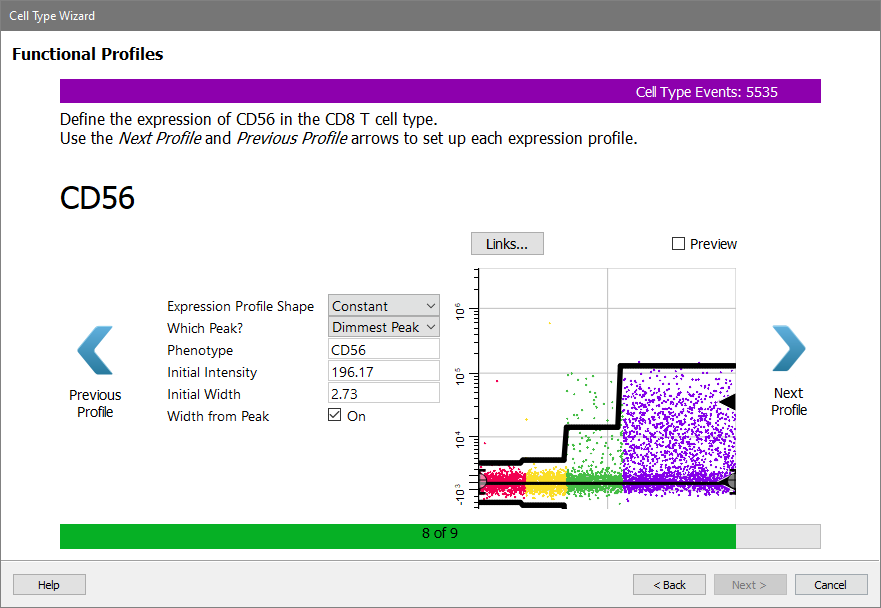
Functional Profiles
Function markers use constant profiles or no profile at all.

The properties of the functional profile are the same as for Selection, except they are repeated for each level of the profile.